
Software
PSR has developed a suite of tools that jointly cover the full range of analytical questions around the power system as well as coupled sectors, such as electricity, natural gas, and the WEF nexus (water, energy, and food security). The different tools can be used separately or combined, depending on analytical priorities, and required technical depth.

STOCHASTIC HYDROTHERMAL DISPATCH WITH NETWORK CONSTRAINTS

LONG TERM EXPANSION PLANNING

SHORT-TERM OPERATION SCHEDULE

TRANSMISSION EXPANSION PLANNING
SDDP
Overview
SDDP is a stochastic dispatch model for electrical systems representing the transmission, gas, and hydrogen networks used in long, medium, and short-term operation studies. It is highly flexible in terms of its temporal and spatial levels of detail. In the temporal dimension, it can represent very long decision horizons (several decades) with weekly or monthly stages and intra-stage resolution of load blocks or hours. Spatially, it can handle the detailed operation of small islands up to the study of regional markets integrating several national power systems.
The model represents the following elements:
- Hydroelectric plants: detailed representation for each reservoir; storage and flow rate limits through turbines, spillways, head effect, infiltration, and others; stochastic inflow model representing seasonality, time, and spatial correlations; modeling of specific climatic phenomena (such as El Niño); ramping constraints, etc.;
- Thermoelectric plants: unit commitment constraints, fuel availability, fuel contracts (including take-or-pay clauses), thermal efficiency curves, CO₂ and other pollutants emission, ramping constraints;
- Variable Renewable Energy: solar, wind, and concentrated solar power plants, the definition of VRE historical, generation through global reanalysis database, stochastic VRE power production, model, generating future synthetic scenarios with hourly resolution, VRE scenarios are temporally and especially correlated with hydro inflows;
- Batteries and other fast storage devices: storage capacity, charge/discharge capacities, efficiencies, ramping constraints;
- Demand side response: response to price, signals by segment by system-, area-, or bus-level;
- Transmission network: Kirchhoff laws, power flow limits, quadratic losses, security constraints, limits on export and import
among electric areas, sum of flow constraints, and others; - Natural gas network: gas production and transportation constraints, production capacity in the fields, pipeline flow limits and losses;
- Hydrogen and electrification processes: hydrogen production, energy consumption, detailed hydrogen supply chain;
- Co-optimization of energy and reserve markets
- Dynamic probabilistic reserve
- Water nexus
The objective of SDDP is to minimize the sum of costs and maximize the revenue in the energy market. Costs include the purchase and transportation of fuels for thermal plants, pollutant emission costs, hydro and thermal plants’ O&M costs, transmission wheeling rates, cost of energy not supplied, and other penalties. Revenues include trades in energy, water, and hydrogen markets.
Main results
SDDP produces over 450 reports in Excel-friendly formatted files. The results are managed by the graphical interface that extracts the desired statistics and creates charts directly in Excel. SDDP’s main results are:
- System operation statistics: production, transmission flows, emissions, deficit risks, and costs
- Locational marginal costs (zone- and bus-level)
- Capacity marginal costs: incremental benefit of reinforcing a resource
- Transmission congestion costs
- Hydroelectric water values and other storage systems’ energy values
- Marginal costs of pollutants with emission budgets
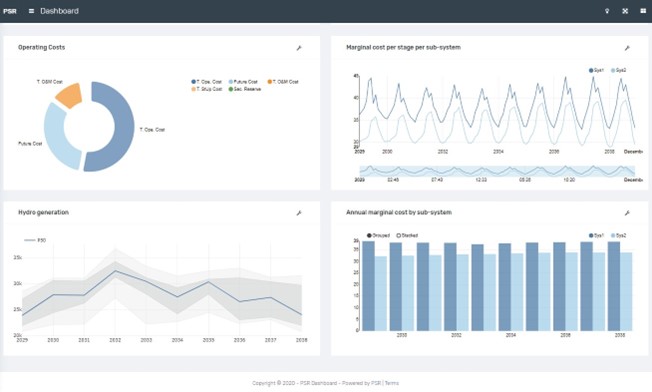
Furthermore, aggregated results such as average marginal costs, total generation, and total costs are produced in CSV-format reports and can be visualized through a dashboard, shareable via an internet link:
Methodology
Since hydro plants have no direct operating costs, they would come first in the merit order curve. However, there is uncertainty regarding future inflows, as illustrated in the figure below.
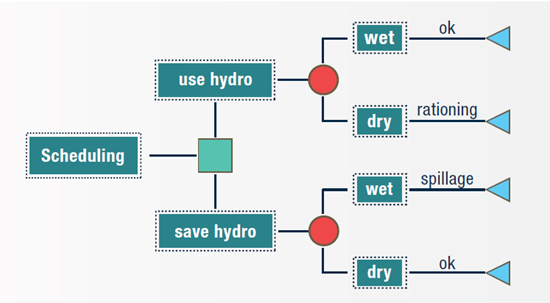
SDDP stands for Stochastic Dual Dynamic Programming, an algorithm developed by PSR in the 1980s for solving large-scale multistage optimization problems under uncertainty. The great intelligence behind it is about the future cost function approximation, made through a Benders decomposition scheme.
This algorithm has been consistently improving over the years to follow the significant changes in the electricity sector. It has been considered the state-of-the-art technology by the global industry. The greatness of the SDDP model is shown in the fact that it has been cited in more than 3,800 articles in the scientific/engineering literature, with a simple search being enough to prove this.
Furthermore, it has been successfully applied for more than forty years for mid- and long-term optimal stochastic scheduling of very complex real systems with multiscale storage (hydro reservoirs, pumped hydro, batteries, fuel reservoirs, integral fuel contracts, multistage emission budgets constraints, etc.) and probabilistic modelings such as hydro inflows, renewable intermittency, demand, and fuel prices.
Parallel computing
SDDP parallel version explores the solution methodology structure based on decomposing the original problem into smaller sub-problems to boost computational efficiency. The sub-problems can be solved simultaneously by several computers connected by a local network or multi-task computer.
Additionally, it is possible to run SDDP using PSR Cloud which is a platform conceived to manage remote executions in a distributed process environment on PSR servers, taking full advantage of cloud computing capabilities.
Uses of SDDP
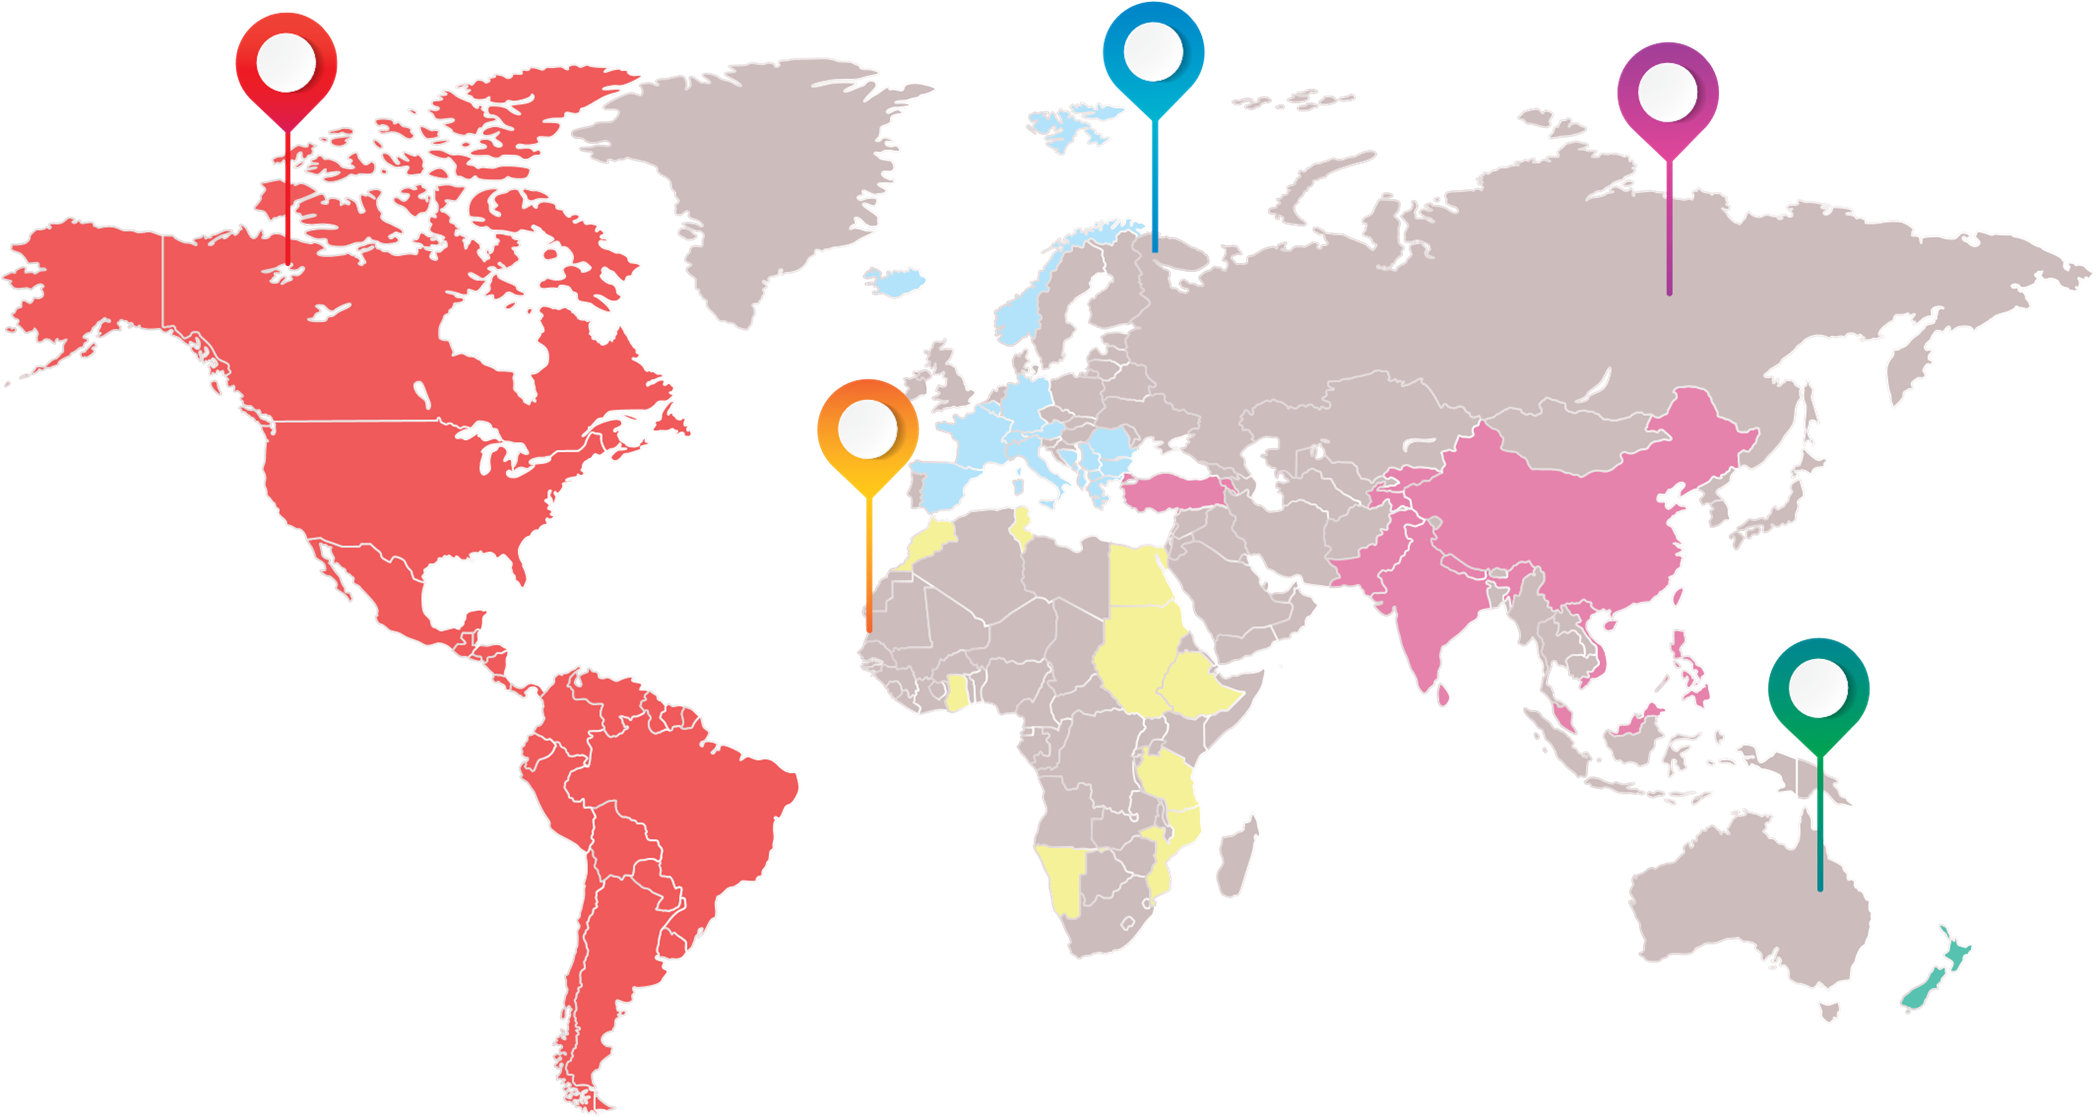
The SDDP model has been used in studies for the valuation of companies, international interconnections, and analysis of new hydro, thermal and renewable power plants. It has also been used in operations studies in several countries on the five continents:
Latest versions
- SDDP 17.3.5
- Download (Windows | Linux)
- Release site
- SDDP 17.2.12
- Download (Windows | Linux)
- Release site
- Detailed release notes
Learn more
- More information in the product sheet
- Contact us at sddp@psr-inc.com
OPTGEN
Overview
OptGen is a long-term expansion planning model that determines the least-cost sizing and timing decisions for construction, retirement and reinforcement of generation capacities, transmission network and natural gas pipelines. Several types of projects are available to be contemplated by the model:

Beyond that, OptGen becomes suitable for different types of power system expansion studies, from the moment that it provides a powerful set of flexible modeling feature. The model allows, for example, the definition of study horizons up to several decades, considering the project’s payment schedule, lifetime, and construction time. It also offers the possibility to incorporate several expansion policies and assumptions, according to the planner’s criteria, such as:

Modeling aspects
The integrated expansion is formulated by OptGen as a large-scale mixed integer programming problem and the solution is obtained using advanced MIP techniques and Benders decomposition.
These following features are used on the formulation:
- Flexibility of investment & operation steps (year, semester, quarter, month);
- Investment decisions represented either by integer or continuous variables;
- Optional and obligatory projects;
- Sets of associated projects;
- Sets of mutually exclusive projects;
- Precedence constraints;
- Minimum capacity constraints for different groups of technology and for different time intervals allowing to represent governmental energy policies;
- Reference marginal cost calculation;
- Environmental constraints: emission of greenhouse gases;
- Fuel availability constraints;
- Multiple scenario analysis;
- Analysis of a complete or partial expansion plan defined by the user.
OptGen aims to deliver consistent results that help both, (i) planners in the expansion decision making process and also (ii) market players, so that they have the best possible view of the system expansion. Based on the state-of-the-art methodologies, the model offers potentially efficient options for solving this problem:
- Optimization procedures, such as the rolling horizon and the horizon year solution strategies
- Analysis and reinforcement of user provided expansion plans
- Graphical dashboard tools to analyze macro operative results
Check the main components of the OptGen model in the figure below and read the topics of each one with the explanation to understand even more.

SDDP – Operation Module
OptGen optimizes the trade-off between investment costs to build new projects and the expected value of operative costs obtained from SDDP, the transmission-constrained multistage stochastic dispatch model. This integration enables OptGen to take advantage of all SDDP’s features to represent an electrical system while solving the operative dispatch. This includes, among others, detailed modeling with hourly or intra-hourly resolution, demand response to price signals, uncertainty sources representation such as:

CORAL – Supply Reliability Evaluation
The integration with CORAL – the reliability analysis model that it’s based on Monte Carlo simulation – enables both system and bus-level indexes, such as LOLP, LOLE, EPNS, to be evaluated for each proposed expansion plan. Moreover, minimum security level constraints can also be incorporated into the optimal expansion process, allowing OptGen to make expansion decisions respecting reliability requirements.
DPR – Dynamic Probabilistic Reserve
The idea of the Dynamic Probabilistic Reserve is to guarantee the supply of electricity through secondary reserves, not only in the event of demand variability or largest unit failure, but also the variability caused by Variable Renewable Energy sources (VREs).
OptGen is the only tool in the market capable of co-optimizing Generation, Transmission and Dynamic Probabilistic Reserves and, therefore, while using OptGen, it is possible to co-optimize flexibility-related investments such as batteries or pumped-hydro-storage (related to probabilistic dynamic probabilistic reserve requirements) and energy-related investments.

Use of OptGen
- SEETEC project for the study of the development plan and benefits of the regional energy market in the Balkan region for 2003-2010. (8 countries interconnected, 30 GW of energy demand and 5 GW of projected increase in demand for 2010);
- Venezuelan plan for expansion of generation and transmission for 2002-2010 (20 GW of installed capacity – 65% hydro – and 10 interconnected regions);
- Expansion study for the Brazilian system 2004-2015 (85 GW of installed capacity – 85% hydro, 27.5 GW projected increase in demand for 2015, 117 hydro plants, 108 thermal plants and 9 interconnected regions).
- It has been used by planning agencies (e.g. CEAC, from Central America), companies and consultants (SNC Lavalin, Electricité de France and others) in expansion studies in several Latin American countries (Bolivia, Ecuador, Colombia, Chile, integrated planning of the six countries of Central America and others); Balkan region; Africa (Tanzania; interconnection of Egypt, Sudan and Ethiopia); and Southeast Asia (interconnection of the Mekong River countries: Laos, Cambodia and Vietnam) and others.
Learn more
- More information in the product sheet
- Latest release site
- Full changelog
- Contact us at optgen@psr-inc.com
- Download: OptGen 8.1
NCP
The NCP is an operative optimization model similar to the SDDP, but more adapted to short-term simulations – with time intervals from 15 minutes to 1 hour and with a weekly or monthly horizon. In addition to the variables and parameters represented in the SDDP, the NCP incorporates additional issues typical of the very short term, such as unit commitment, “ramping” of thermoelectric power plants, and water travel time.
In order to integrate long-term optimal operation with short-term optimal operation, the cadastral data and the future cost function of the SDDP can be imported by the NCP. In turn, the NCP data can be imported into other software that calculate power flows in networks, such as NetPlan. This integration is automatic in the ePSR environment.
Modeling aspects
The following aspects are modeled by the NCP:
- Demand balance equation at each bus, including quadratic losses in the transmission network circuits
- Linear power flow model, including capacity constraints on circuits for the base case and contingencies
- Water balance equation for cascade plants considering water travel time and wave propagation
- Minimum and maximum power restrictions for each plant, considering unit commitment decisions
- Minimum, warning and standby stored volumes for flood control in reservoirs
- Minimum and maximum effluent flow restrictions and restrictions on the rate of change of these flows
- Integration options with medium-long term studies: target generation, target volume and future cost function reading
- Restrictions of thermal plants: minimum operation and stop time, power ramps, fuel availability, number of starts
- Hydroelectric production modeled per unit based on the efficiency curve of the turbine-generator set, hydraulic losses, elevation of the tailrace and elevation x volume curve
- Security restrictions (primary and secondary reserve, circuit flow sum restrictions, generic generation restrictions, etc.)
The solution is achieved using advanced mixed linear-integer programming techniques.
System features
- Graphic interface in Windows environment;
- Includes module for preparing graphs with model results in MS Excel;
- Several results (ex: hydroelectric and thermal generation, marginal costs, flows in the circuits, stored volumes, etc.).
Application examples
- Cargo dispatch centers in Bolivia, Ecuador, Guatemala, El Salvador and Peru (daily and weekly operation schedule)
- Turkey’s biggest power generators with more than 30,000 MW
- Institutions from a number of Balkan countries in Southeast European Electrical System Technical Support project activities
- Agder Energi (Norway) to maximize revenue in the NordPool market
- Evaluation for use in the daily programming of the Brazilian electrical system (~5800 circuits, 3900 buses and more than 100 hydroelectric plants)
Methodology
Short-term operational optimization model (cost minimization or revenue maximization) (intervals from 15 minutes to 1 hour, weekly or monthly horizon) based on mixed integer programming, with detailed representation of hydroelectric, thermoelectric and renewable generation, transmission network with losses, unit commitment, water travel time, environmental constraints, reserves, steam extraction in thermals, coupling with medium-term models, etc.
It represents, in detail, hydroelectric systems (water balance for cascade plants, pumps, irrigation, etc.), thermoelectric plants (unit commitment, ramp restrictions, fuel flexibility, concave efficiency function), transmission network (Kirchhoff laws, losses quadratics, security constraints, etc.) and final condition at the end of the one-week stage (interface with the SDDP model). NCP is used in several countries in South and Central America by wholesale energy market operators (to determine the hourly price) and System Operators (real-time dispatch interface).
NCP determines the operation of a hydrothermal system with transmission restrictions in order to minimize production costs or to maximize revenues from the sale of energy to the market. Costs include the use of fuels (variable cost of production and start-up), cost of deficit, penalties for violating operating restrictions, among others.
Related downloads
The following files require a password for installation.
- More information in the product sheet
- Latest release site
- Contact us at ncp@psr-inc.com
- Knowledge Hub
- Download: NCP 5.28
NETPLAN
NetPlan is an integrated computational environment for transmission network planning and analysis which includes:
- data management tools (data editing, external data importation)
- study management resources (data coherency checking and chronology)
- visualization resources for the network and study results (schematic diagrams, circuit flows, overflow indicators, expansion plan cost, load marginal cost, contour plots)
- graphical interface that allows interaction with different modules
The following modules are available in the NetPlan environment:
- OptNet, for optimization of expansion planning of high voltage transmission network
- PSRFlow, for AC and DC transmission network analysis
- OptFlow, for AC and DC transmission network analysis of reactive power resources (VAr)
- OptVar, for planning of reactive power resources (VAr)
- Tariff, for allocation of transmission costs among generators and loads
All models use optimization tools specially designed to solve large scale networks.
The OptNet module – Transmission expansion planning
Modeling Aspects
OptNet models the transmission expansion planning as a MIP problem with the following features:
- Representation of linearized power flow model for the transmission system
- Representation of generation dispatch scenarios produced by SDDP model in order to account for uncertainties in load and generation production (hydro plant inflows and renewable resources)
- Decisions on new transmission facilities: AC transmission lines, transformers, series capacitors and dc transmission system
- Representation of project constraints: sets of associated projects, sets of mutually exclusive projects and precedence constraints
- The expansion process can be applied considering all circuits in operation (base case) as well as to selected single circuit contingencies
- Outputs include the expansion plan decided by the model and detailed operating results that can be graphically displayed in the network diagram and\or visualized using Excel spreadsheet
Solution methodology
The objective function consists in minimizing the investment cost to install new facilities and the supply reliability cost, providing the best investment x supply reliability cost trade-off solution. The solution of the mixed integer optimization program is provided using advanced techniques of mixed integer programming.
The methodology combines a heuristic method, that guarantees a feasible solution, with a Benders decomposition method that provides an optimal solution when the convergency is reached. Dispatch scenarios and contingencies are dealt by an incremental expansion strategy which makes the algorithm suitable to be used in planning studies of large networks with high penetration of renewable generation.
The PSRFlow module – AC and DC transmission network analysis
Modeling Aspects
- Applications designed for steady state analysis of transmission network
- Includes a conventional AC and DC power flow and contingency analysis
- Integration with generation dispatch scenarios produced by SDDP model
- Outputs include detailed operating results that can be graphically displayed in the network diagram and\or visualized using Excel spreadsheet
Solution methodology
The power flow application solves the load flow equations by use either a fast decoupled or a conventional Newton Raphson method, for AC and DC controls. Linearized power flow is also available.
The contingency analysis application processes a list of contingencies with the objective to detect and report network violations (circuit flow, bus voltage, etc.)
The OptFlow module – AC and DC transmission network analysis of reactive power resources (VAr)
Modeling Aspects
The OptFlow module is the computational tool for AC and DC transmission network analysis of reactive power resources with the following features:
- Representation of different generation and load scenarios produced by SDDP model to capture uncertainties in renewable sources (hydro inflow, wind, solar)
- Modeling of the non-linear active and reactive power balance of each node of the electric grid (Kirchhoff laws)
- Modeling of different network operation limits: voltage magnitude, active and reactive power flow transportation in the circuits, transformer taps, shunt, svc
- Outputs operating results can be graphically displayed in the network diagram and\or visualized using Excel spreadsheet
Solution methodology
The objective function considers the minimization of the sum of allocation of reactive power injection in the buses (to detect deficit of Var and its location in the network) together with the penalized deviation of the active power generation setpoint.
Decision variables include active and reactive power generation of the units, bus voltage angles, transformers taps, and capacitor/reactor susceptance.
The solution methodology consists in applying a robust primal-dual interior point algorithm for each represented scenario. The solution provided by the model guarantees the operation limits and constraints are obeyed for each generation and load scenario and identifies possible VAr deficiencies and their location in the network.
The OptVar module – Planning of reactive power resources (VAr)
Modeling Aspects
The OptVar module is the computational tool for reactive expansion planning with the following features:
- Representation of different generation and load scenarios produced by SDDP model to capture uncertainties in renewable sources (hydro inflow, wind, solar)
- Representation of investment in shunt equipment as new reactive power resources
- Modeling of the non-linear active and reactive power balance of each node of the electric grid (Kirchhoff laws)
- Modeling of different network operation limits: voltage magnitude, active and reactive power flow transportation in the circuits, transformer taps, shunt, svc
- Outputs include the expansion plan decided by the model and detailed operating results that can be graphically displayed in the network diagram and\or visualized using Excel spreadsheet
Solution methodology
The solution methodology consists of a Progressive Hedging algorithm that determines an expansion plan in shunt equipment as new reactive power resources, interacting with the OptFlow module to solve each of the optimal power flow problems.
The objective function considers the minimization of the sum of shunt investment cost and the penalized deviation of the active power generation setpoint.
Decision variables include active and reactive power generation of the units, bus voltage angles, transformers taps, and capacitor/reactor susceptance (existent and candidate elements).
The investment solution provided by the model guarantees the operation limits and constraints are obeyed for each generation and load scenario, where all available reactive controls were considered.
The Tariff module – Power transmission cost allocation (coming soon)
Modeling Aspects
The Tariff module is a computational tool designed to promote the allocation of costs related to the transmission system infrastructure among its users (producers and consumers). To perform such a task, the Tariff is able to:
- Identify how producers and consumers use the system to allocate costs accordingly
- Allocate costs considering an extensive range of operating scenarios, making tariff calculations adherent to the real electrical system operation and planning
The Tariff is a powerful tool for the power sector agents with relevant aspects for:
- System planners and regulators that can use it to reveal the transmission expansion actual costs and promote cost allocation and determination of tariffs; or it can be used as a planning tool to evaluate different cost allocation methodologies and select the more adherent to the electrical system-
- Generator and consumers who seek to forecast future tariffs and costs-
Solution methodology
The Tariff model can adopt three different transmission cost allocation methodologies:
- The nodal: used by Brazil and UK to allocate transmission costs. It is based on the marginal impact generators’ and consumer’s injections have over the energy flow in transmission facilities
- The Average Participation Factors: commonly used to allocate costs in problems involving transport infrastructure. It traces the path of generators’ and consumers’ injections over the grid
- The Aumann-Shapley: based on the game theory concept, assures fair cost allocation, modeling the transmission business as a coalition in which each agent can optimize costs of energy transportation
Some recent applications
- Designing alternatives for the future development of the Chilean National Transmission System (horizon 2019-2040). NetPlan were used to optimize the expansion of the transmission network, considering the insertion of new energy resources (wind and solar) and batteries
- NetPlan were used to optimize the network expansion for the Brazilian system for the horizon 2035, taking in account a large degree of renewable energy sources (wind and solar)
- Analysis and regulatory proposals for the Ancillary Services for the Colombian systems, considering the insertion of variable energy renewable resources and new technologies in high and low voltage. NetPlan were used to study the expansion of the Colombian transmission system for the horizon 2019-2040
- Renewable integration of South America. NetPlan were used to optimize the transmission expansion (2017-2035) in nine South America countries, participants of the Andeans community (Chile, Colombia, Ecuador and Peru), Southern Cone (Argentina, Brazil, Paraguay and Uruguay) and Bolivia
- Expansion planning of the WECC transmission network for a 15-year horizon, peak yearly dispatch scenarios and 960 projects
- Analysis and regulatory proposals for transmission cost allocation mechanisms in Brazil. NetPlan was used to simulate the transmission tariff calculation using different methodologies in order to assess the impacts over tariffs of generators represented by the Brazilian Wind Power Association (ABEEólica).
Related downloads
The following files require a password for installation.
- More information in the product sheet
- Contact us at netplan@psr-inc.com
- Download: Readme
- Download: NetPlan 4.3

DEVELOPMENT OF HYDROELECTRIC AND PUMPED STORAGE POWER PLANT HERA (IVY)

MODELING OF NON-CONVENTIONAL RENEWABLE RESOURCES
HERA
HERA is a computational model developed by PSR to study the hydroelectric potential of watersheds, considering the economic viability of projects and their socio-environmental impacts.
The model aims to contribute to the decision-making process, which is generally very complex because it involves conflicting interests for and against the construction of dams. For this, a balance is sought between electricity production and environmental conservation.
HERA simulates the construction of hydroelectric plants, including the area flooded by reservoirs. The model scales structures according to the Eletrobras Hydroelectric Inventory and Hydrographic Basins Manual (different types of dams, spillways, powerhouses, channels, diversion schemes, tunnels, etc.) and calculates the corresponding costs (concrete, excavation of rock and soil, etc.). Calculations are made for candidate sites, considering a digital elevation model, or terrain. Then HERA adds the costs of electromechanical equipment associated with the capacity of the candidate project, and the socio-environmental costs, which are generally associated with the area flooded by the reservoir, including removal of vegetation, environmental compensations, relocation of affected infrastructure (roads, bridges, etc. .), as well as resettlement of the affected population.
Costs are calculated for each candidate project, each of which can be simulated with different hydraulic heads and engineering designs (evaluated from the combination of different types of structures and their positioning along the dam axis). A list of candidates is then prepared, from which the best combination will be selected by an optimization model. The mathematical model includes physical constraints of the system, such as water balance equations, operational limits, as well as socio-environmental constraints related to the impacts of the projects (number of families affected, flooded area, etc.).
HERA has been used by PSR in studies for The Nature Conservancy in watersheds in Colombia (Magdalena River), Gabon (Komo and Abanga Rivers), Brazil (Juruena, Ivaí Rivers) and Mexico (Coatzacoalcos). In Brazil, the National Electric Energy Agency (ANEEL) has shown interest in promoting its use in participatory inventory studies, where environmental agencies, public prosecutors, mayors, government institutions, project developers, indigenous groups and others can use the tool as part of a stakeholder engagement process to assist decision making. This would allow an objective evaluation of the alternatives, in addition to ensuring greater transparency and agility: a process that historically would take several months could be reproduced in a few hours with HERA, thus allowing an exploration of the alternatives in “real time”. HERA possesses several innovative aspects, for example:
1. Automation of geoprocessing functions oriented to the investigation of hydroelectric potential (calculation of the hydrographic network, simulation of reservoirs considering elevation x area x volume curves, regionalization of flow history, etc.).
2. Calculation of user-defined metrics based on geographic information (maps in shapefile format), which are used to estimate the impacts of each project individually in combination with other projects.
3. Automation of project design, including engineering design and cost estimation.
4. Possibility for the engineer to edit or modify dimensioning parameters: for this, an input and output data dictionary is used. The parameters (for sizing the spillway, for example) can be edited in Excel. The new computational procedure is then “compiled” for execution into Python code incorporated into the HERA model.
5. Distributed computing (in the cloud) can be used in large watersheds.
6. Mathematical formulation that selects the best combination of projects in that watershed (in an effort to maximize the objective function value).
7. Export of results to other GIS software, Google Earth and others.
8. Integration with Revit for 3D visualization of structures.
9. Programming in Dynamo to build 3D models of hydroelectric power plants from individual components considering the digital elevation (or terrain) model.
10. Advanced architectural visualization of selected hydropower projects in Infraworks 3D.
Licensing information
Please contact hera@psr-inc.com for more information on commercial licenses.
HERA is free for non-profit organizations.
HERA is the result of a research and development project under Aneel’s Research, Development and Innovation Program. Below is a list of the R&D projects related to HERA and their respective supporters:
1- ANEEL R&D 0678-0113/2013: HERA – Supporter: EDF Norte Fluminense
2- ANEEL R&D 0678-0116/2016: Environmental Assessment and Engineering Arrangements (Interface and 3D) – Supporter: EDF Norte Fluminense
3- R&D ANEEL 00678-0120/2020: Reversible Module – Supporters: CTG Brasil, Elera and Light


![]()
![]()
![]()
Please contact hera@psr-inc.com to request a free license.
Related downloads
The following files require a password for installation.
Time Series Lab (TSL)
Time Series Lab (TSL) is a renewable modeling tool that produces synthetic scenarios for future generation of Variable Renewable Energy sources (VREs). TSL has two main modules: (i) TSL-Data; and (ii) TSL-Scenarios:
- TSL-Data: creates a 40-year “synthetic” hourly historical record by processing the information available in the global reanalysis database;
- TSL-Scenarios: generates future ERV scenarios considering the temporal and spatial correlation with hydrological flows;
To estimate the statistical model, TSL-Scenarios needs a historical record of the generation of ERVs, which can be a complicated task depending on the region. Therefore, TSL has two main modes of operation:
- Users can enter actual historical data records
- TSL-Data can create a “synthetic” 40-year historical record based on wind speed and solar irradiation data from the reanalyses database.
Creating a historical record of renewable generation
TSL calculates wind production through a model based on the Virtual Wind Farm (VWF) methodology. The following parameters are used to convert wind speed into energy:
- The turbine power curve
- Turbine height
- The plant coordinates (to download wind speed data)
Solar output is based on Global Horizontal Irradiance data, i.e. the irradiation at the top of the atmosphere and the temperature extracted from the reanalysis database. Taking this information into account, the GSEE (Global Solar Energy Estimator) method is applied. The following parameters are considered in the energy conversion:
- The solar panel tracking system
- The tilt angle of the panel
- The coordinates of the solar plant (to download solar irradiation and temperature data)
Location of “hotspots” for generic projects
In addition to providing tools for creating “synthetic” historical records of renewable generation, TSL provides a tool for finding “hotspots” for generic wind and solar energy projects. For this, the following tools are available:
- Wind speed map for the whole world
- Solar irradiation map for the whole world
- Protected areas around the world
- Possibility to load user-defined custom maps
Generating synthetic renewable generation scenarios correlated with flows
Due to the spatial correlation of wind and solar production in different regions, as well as the spatial correlation between streamflow and wind speed series in others, the TSL represents the joint probability distribution of all non-conventional renewable resources and hydropower plants, both for existing and future plants.
The Bayesian Network is a statistical model that can produce synthetic scenarios, capturing the most significant correlations existing in historical data. This methodology has the following characteristics:
- Produce scenarios considering a joint probability distribution
- Nonparametric estimation of the probability distribution of each plant
- Maintains historical spatial and temporal correlations in synthetic scenarios
- Keeps the original probability distribution of historical data
In summary, due to the high variability and intermittency of this type of resource, TSL generates these scenarios with the following characteristics:
- Hourly resolution
- Nonparametric estimation of probability distributions
- Bayesian network methodology to capture spatial and temporal correlations between ERVs and hydrological flows
Related downloads
The following files require a password for installation.

ECONOMIC AND FINANCIAL EVALUATION OF GENERATION PROJECTS

MANAGEMENT AND OPTIMIZATION OF ENERGY PORTFOLIOS
OPTVALUE
The OptValue model is a tool for the economic and financial evaluation of generation projects based on the search for an internal rate of return compatible with the risk associated with the construction and operation of the plant. This allows the comparison os different generation technologies from a risk x return perspective.
The model is based on calculating an energy price such that the internal rate of return (IRR) for shareholders associated with the project will be above a value at a certain pre-established VaR level (e.g. with probability that 95% the IRR will be above 15%). This calculation involves the investment cost of the plant, the “project finance”, type of contract for the sale of energy, taxes and sector charges, uncertainties associated with hydrology, investment costs, construction time, regulatory aspects, etc.
The program outputs are:
- Project energy price compatible with a given minimum value for the shareholder’s IRR at a pre-established “Value at Risk” (VaR) level or an expected value of the shareholder’s IRR;
- Probability distribution for the shareholder’s IRR;
- Probability distribution for net and discounted project revenue;
- Optimal contracting level for hydraulic power plants;
- Cash flow probability distribution;
- Breakdown of energy price into: Investment costs, taxes and sector charges, O&M costs, fuel costs, etc.;
- Time series graphs associated with power plant generation, revenues and expenses at CCEE, net revenue for shareholders, etc.
The risk x return tradeoff associated with projects is established in terms of the standard deviation versus the expected value of the IRR.
Related downloads
The following files require a password for installation.
OPTFOLIO
Analytical tool for managing and optimizing energy portfolios composed of physical assets (hydroelectric, thermal and renewable plants) and financial assets (forward contracts, derivatives and others). OptFolio uses integer programming and stochastic optimization techniques to build contract portfolios from a risk-return perspective using risk indices (such as CVaR and utility functions) and has been used in commercial studies in Brazil and abroad (Turkey) for optimization of energy contracts and integrated commercialization of renewables.
Optfolio – optimal mix of physical and financial assets considering spot price scenarios, energy production and associated risk constraints. OptFolio has been used by clients in Europe to determine the optimal dispatch / contracting strategy in short-term markets, and in Latin America to optimize the portfolio of multinational assets to generate international investors.
The OptFolio model is a decision tool for managing energy portfolios, including physical assets such as power plants and financial assets such as bilateral contracts and other electricity derivatives.
The objective is to maximize the present value of net cash flow for a given firm. There are several sources of costs and revenues that are calculated by Optfolio in the composition of the net cash flow:
- Generation costs, transmission tariffs, other fixed costs, taxes, financial costs associated with acquired contracts and derivatives, and investment costs associated with the construction of new plants;
- Financial income from sales of energy contracts and other derivatives;
- Revenues from energy sales in the short-term market where there are uncertainties regarding prices.
The program determines optimal investment decisions in physical assets (i.e. construction of new plants) and financial assets (i.e. purchase or sale of contracts or other derivatives). Risk constraints in terms of “Value at Risk” (VaR) such as a minimum revenue requirement at a risk level may be considered.
The model has three options for the objective function:
- Maximize the expected value of net revenues;
- Maximize the expected value of the utility function;
- Maximize minimum cumulative revenues at specified time intervals and across a set of hydrological scenarios.
The model represents the following aspects:
- Mandatory projects and set of mutually exclusive projects;
- Hiring limits;
- Investment restrictions;
- Risk restrictions in terms of “Value at Risk” – VaR;
- Internal rate of return associated with each scenario.
- Solution Approach
- The problem is formulated as a mixed integer programming problem.
Related downloads
The following files require a password for installation.

CORPORATE SYSTEM FOR THE MANAGEMENT OF ENERGY STUDIES

CLOUD COMPUTING TOOL
ePSR

ePSR is a corporate computing environment designed to facilitate the collaborative development of energy studies. With a design strongly centered on a commonly used database, the ePSR architecture integrates PSR models, and can be extended to integrate third-party products.
ePSR adopts the “workbench” philosophy: all information and models are available in a relational database. Resources are made available to users through a graphical interface that has a user authentication and authorization scheme. Based on the registered user profile, the scheme allows configuring which resources will be available. Developed with the most advanced information technologies, ePSR offers numerous corporate facilities that increase the organization and productivity of studies. These can be as diverse as scheduling the next hour’s operation or energy planning with a 20-year horizon.
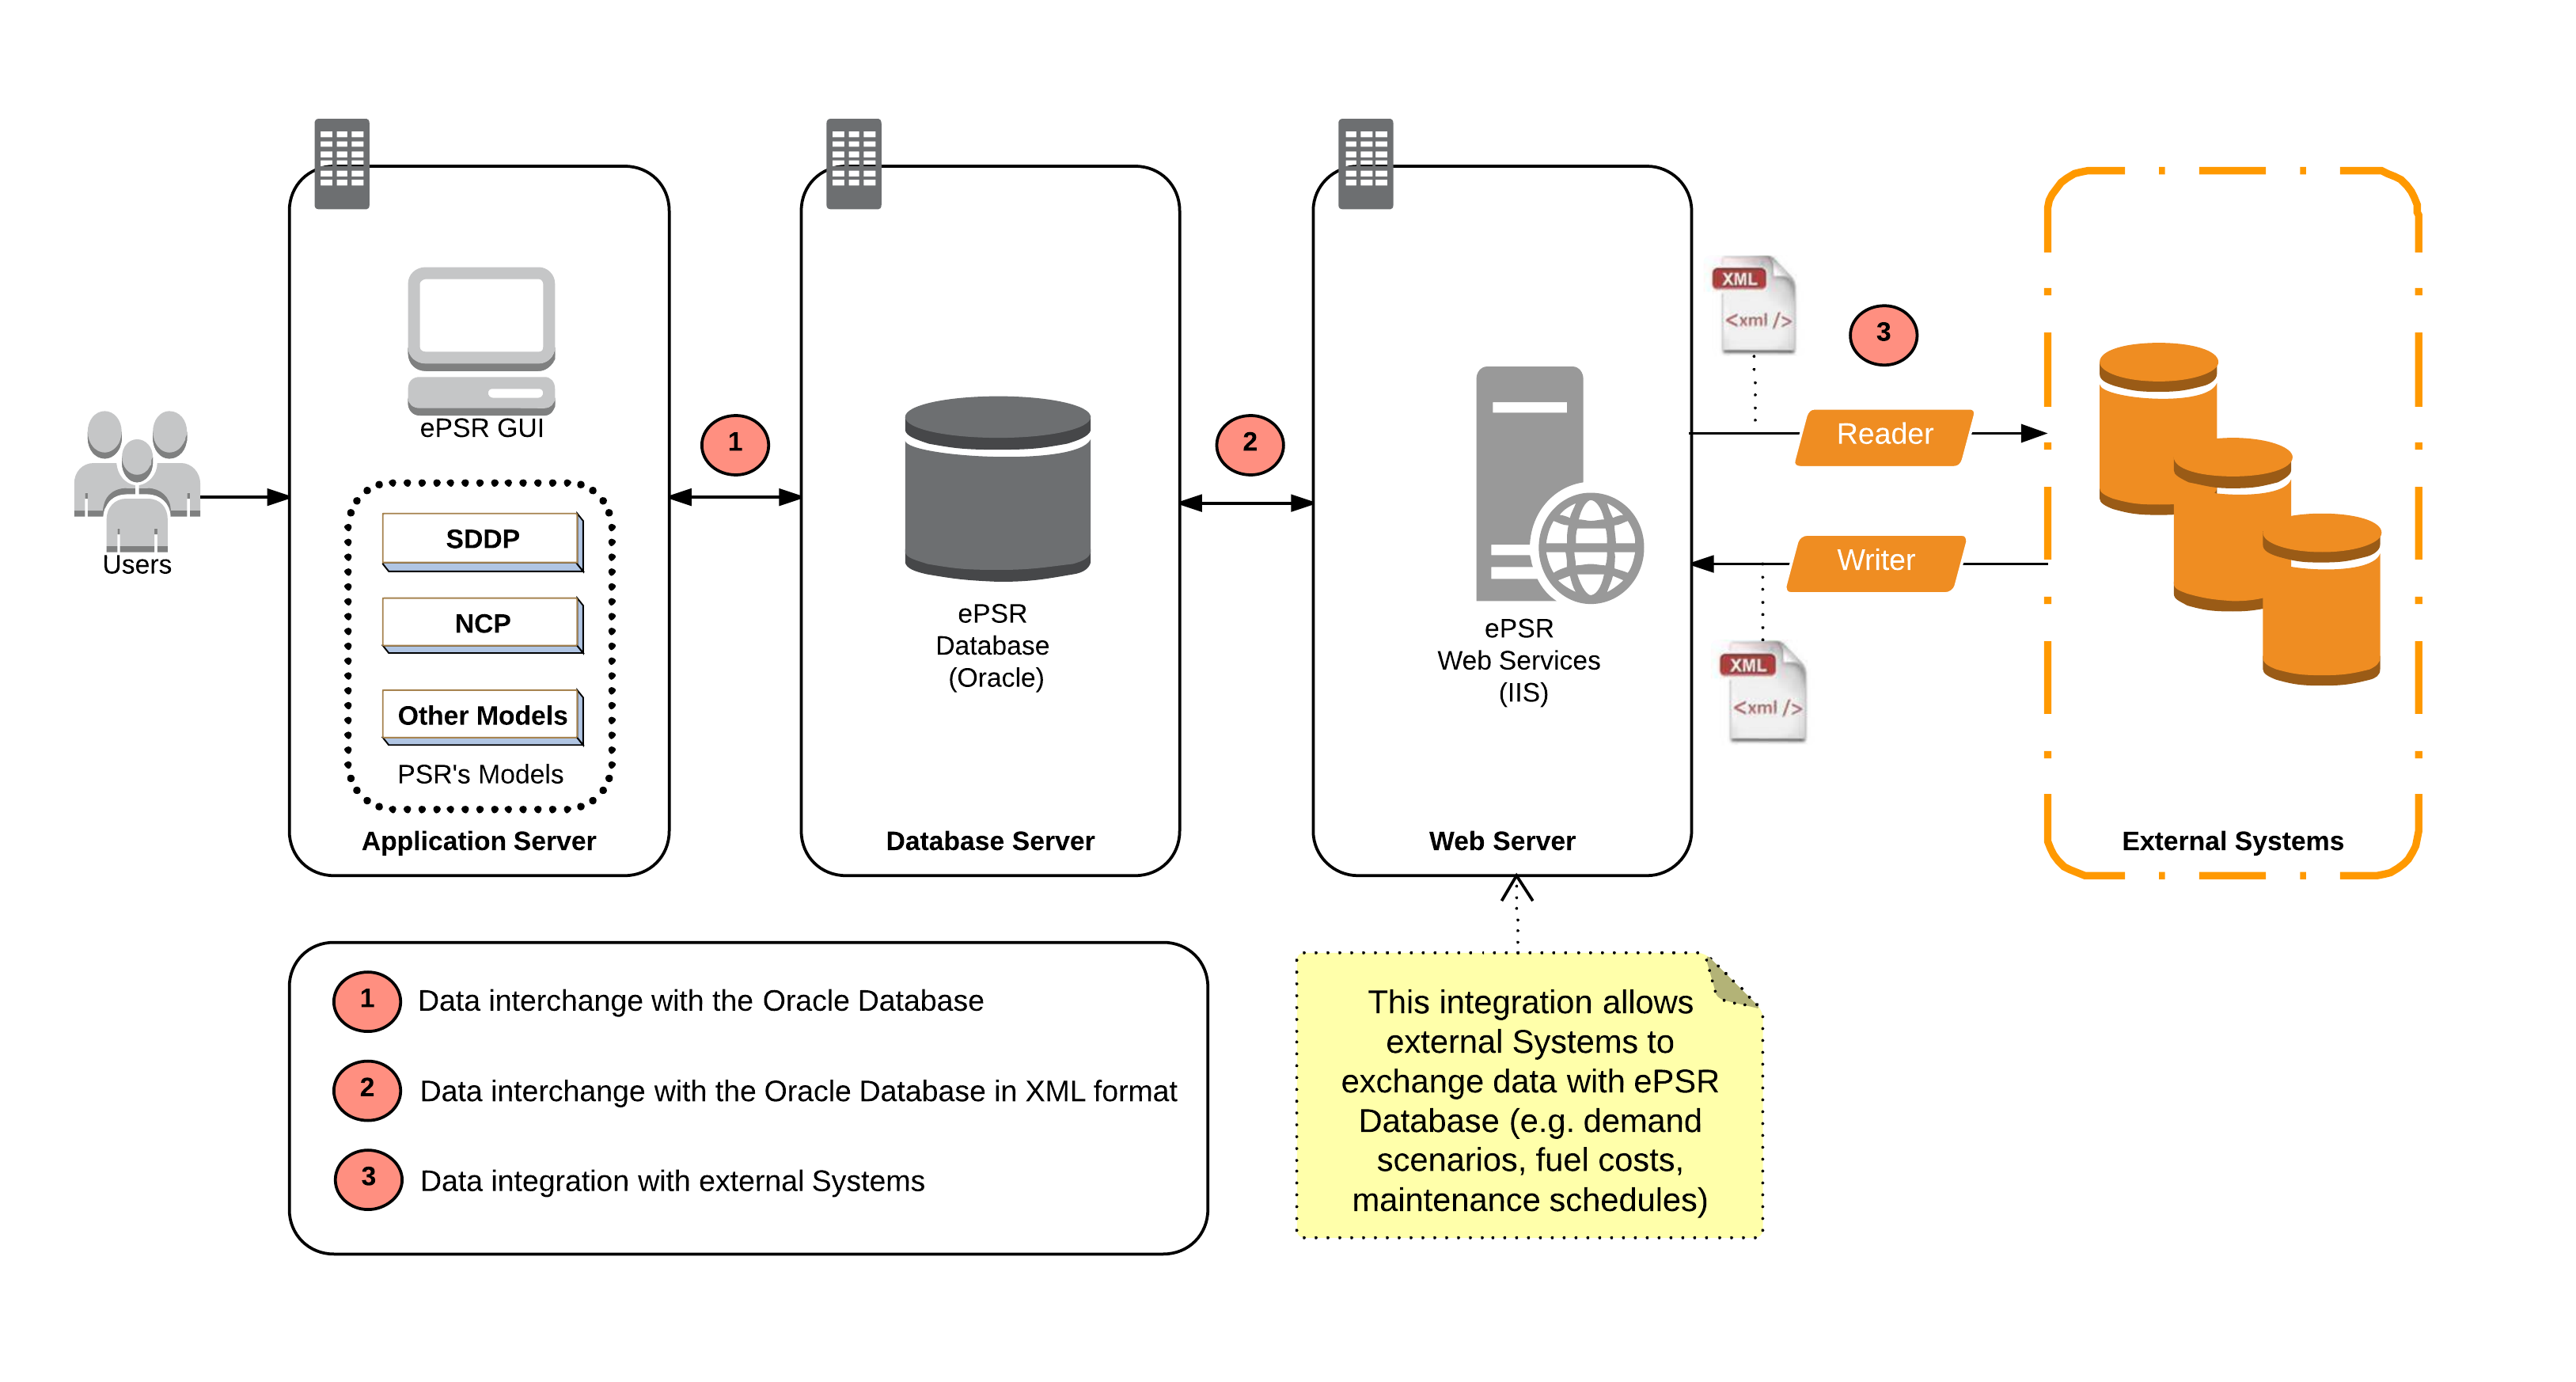
ePSR General Architecture
ePSR was developed in an architecture composed of a graphical user interface; business rules; data access rules; data access functions; database management system, stored data, applications (templates) and data format converters.
Information Resources
The information contained in the ePSR Database is organized into five main categories.
- Power System Components – describe the components of the generation and transmission system. Some components are constant while they may vary over time. Components are versioned. This means that the state of the profile for any moment in time can be reconstructed from the Database. This feature is useful for auditing activities and reproducing previous simulations and studies.
- Configurations – represent the organizations of the power system. Configurations are defined by grouping power system components into interrelated sets.
- Time series – represent historical data and predicted scenarios.
- Constraints – operative rules that restrict power dispatch.
- Study Management – manage studies stored in the Database. A study is built from the selection of available information from configurations, historical data and forecast scenarios from the Database. Application specific parameters are required to execute a desired model. At the time of creating a study, all information available in the ePSR Database is available, even those defined by other users.
Energy Models
ePSR integrates a suite of PSR templates for:
- Medium and long term planning (SDDP)
- Short term power dispatch planning (NCP)
- Generation Expansion Planning (OptGen)
- Transmission Expansion Planning (NetPlan)
- Economic Evaluation and Risk (OptValue)
ePSR can also be integrated into real-time SCADA systems.
Geographic Representation
The Power System components in the ePSR can be associated with a geographic location (geo-referenced), expressed through geographic coordinates (latitude and longitude).
Geo-referenced components can be visualized on a map using one of three background map options:
- Open Street Map
- Bing map
- Google Satellite Image
Technical Reference
- Operating System: Windows
- Graphic Interface: .Net Desktop
- Database: Oracle DBMS
- Web Server: Microsoft IIS
- Format for data exchange: Web Services and XML
Related downloads
The following files require a password for installation.
PSR Cloud
The problem of electricity generation has changed from private systems – local to the regions where they were intended to supply demand – to meet global demands from large generators, located at strategic points and supported by a distribution network of great capillarity. Similarly, we are at a time when high-performance computing, which implies high costs for hardware, software and specialized personnel, is leaving corporate data centers and migrating to first-class data centers. They offer processing power, bandwidth, power provision, support, hardware and software investments at an unmatched cost. This modality of computing is called cloud computing.
PSR has developed a platform to manage the remote execution of hydrothermal dispatch simulation models in a distributed processing environment, so that users do not need to have the necessary infrastructure to achieve the same goal. This platform is called PSR Cloud and currently has thousands of processors.
Data communication (input and output files of the models) is carried out between the user’s local computer and the remote servers allocated for execution, without any interference or passage through PSR’s servers.
PSR Cloud is billed as a pay-per-run service on a prepaid basis. In prepaid mode, the user acquires credits to be used in executions. The cost of each round is accounted for and deducted from the current balance.
How reliable is the service?
Computing capacity is provided through PSR’s relationship with Amazon.com. Amazon has emerged as an important global supplier of processing capacity, having one of the largest data centers in the world. Amazon’s platform availability meets the most stringent international standards and is currently the largest capacity provider on a global scale.
PSR recently had their solution reviewed and published by Amazon as a case study. See details at: http://aws.amazon.com/solutions/case-studies/psr/
In addition, PSR was certified by Amazon, receiving the title of Solution Provider. Details can be found at: http://www.aws-partner-directory.com/PartnerDirectory/PartnerDetail?Name=PSR
How to begin using the service?
Installing PSR Cloud is straightforward. Initially, it is necessary to download and install the PSR Cloud Client module.(*)
Activating the user in the service, after installing the program, is very simple: the user registers on our portal, creating a login and password. Following that, the user will send the login created to psrcloud@psr-inc.com for the account to be activated.
When opening the PSR Cloud Client, the user will add their cases, selecting for each one of them through a simple and intuitive interface:
- The model that will run (SDDP or NEWAVE – the user must have a license for the model that will be used),
- The number of processors to be employed,
- The directory on the local computer where the case data is located (and where the results will go after the run)
When commanding the execution, the input data are automatically sent to the servers allocated in the clouds for execution and from where, after the execution, the output files will be downloaded to the local directory.
Send an email to psrcloud@psr-inc.com with any questions you may have about the service.
(*) It is necessary to install the following dependency:
Microsoft .NET Framework Version 4.0
Related downloads
The following files require a password for installation.
STOCHASTIC HYDROTHERMAL DISPATCH WITH NETWORK CONSTRAINTS
SDDP
Overview
SDDP is a stochastic dispatch model for electrical systems representing the transmission, gas, and hydrogen networks used in long, medium, and short-term operation studies. It is highly flexible in terms of its temporal and spatial levels of detail. In the temporal dimension, it can represent very long decision horizons (several decades) with weekly or monthly stages and intra-stage resolution of load blocks or hours. Spatially, it can handle the detailed operation of small islands up to the study of regional markets integrating several national power systems.
The model represents the following elements:
- Hydroelectric plants: detailed representation for each reservoir; storage and flow rate limits through turbines, spillways, head effect, infiltration, and others; stochastic inflow model representing seasonality, time, and spatial correlations; modeling of specific climatic phenomena (such as El Niño); ramping constraints, etc.;
- Thermoelectric plants: unit commitment constraints, fuel availability, fuel contracts (including take-or-pay clauses), thermal efficiency curves, CO₂ and other pollutants emission, ramping constraints;
- Variable Renewable Energy: solar, wind, and concentrated solar power plants, the definition of VRE historical, generation through global reanalysis database, stochastic VRE power production, model, generating future synthetic scenarios with hourly resolution, VRE scenarios are temporally and especially correlated with hydro inflows;
- Batteries and other fast storage devices: storage capacity, charge/discharge capacities, efficiencies, ramping constraints;
- Demand side response: response to price, signals by segment by system-, area-, or bus-level;
- Transmission network: Kirchhoff laws, power flow limits, quadratic losses, security constraints, limits on export and import
among electric areas, sum of flow constraints, and others; - Natural gas network: gas production and transportation constraints, production capacity in the fields, pipeline flow limits and losses;
- Hydrogen and electrification processes: hydrogen production, energy consumption, detailed hydrogen supply chain;
- Co-optimization of energy and reserve markets
- Dynamic probabilistic reserve
- Water nexus
The objective of SDDP is to minimize the sum of costs and maximize the revenue in the energy market. Costs include the purchase and transportation of fuels for thermal plants, pollutant emission costs, hydro and thermal plants’ O&M costs, transmission wheeling rates, cost of energy not supplied, and other penalties. Revenues include trades in energy, water, and hydrogen markets.
Main results
SDDP produces over 450 reports in Excel-friendly formatted files. The results are managed by the graphical interface that extracts the desired statistics and creates charts directly in Excel. SDDP’s main results are:
- System operation statistics: production, transmission flows, emissions, deficit risks, and costs
- Locational marginal costs (zone- and bus-level)
- Capacity marginal costs: incremental benefit of reinforcing a resource
- Transmission congestion costs
- Hydroelectric water values and other storage systems’ energy values
- Marginal costs of pollutants with emission budgets
Furthermore, aggregated results such as average marginal costs, total generation, and total costs are produced in CSV-format reports and can be visualized through a dashboard, shareable via an internet link:
Methodology
Since hydro plants have no direct operating costs, they would come first in the merit order curve. However, there is uncertainty regarding future inflows, as illustrated in the figure below.
SDDP stands for Stochastic Dual Dynamic Programming, an algorithm developed by PSR in the 1980s for solving large-scale multistage optimization problems under uncertainty. The great intelligence behind it is about the future cost function approximation, made through a Benders decomposition scheme.
This algorithm has been consistently improving over the years to follow the significant changes in the electricity sector. It has been considered the state-of-the-art technology by the global industry. The greatness of the SDDP model is shown in the fact that it has been cited in more than 3,800 articles in the scientific/engineering literature, with a simple search being enough to prove this.
Furthermore, it has been successfully applied for more than forty years for mid- and long-term optimal stochastic scheduling of very complex real systems with multiscale storage (hydro reservoirs, pumped hydro, batteries, fuel reservoirs, integral fuel contracts, multistage emission budgets constraints, etc.) and probabilistic modelings such as hydro inflows, renewable intermittency, demand, and fuel prices.
Parallel computing
SDDP parallel version explores the solution methodology structure based on decomposing the original problem into smaller sub-problems to boost computational efficiency. The sub-problems can be solved simultaneously by several computers connected by a local network or multi-task computer.
Additionally, it is possible to run SDDP using PSR Cloud which is a platform conceived to manage remote executions in a distributed process environment on PSR servers, taking full advantage of cloud computing capabilities.
Uses of SDDP
The SDDP model has been used in studies for the valuation of companies, international interconnections, and analysis of new hydro, thermal and renewable power plants. It has also been used in operations studies in several countries on the five continents:
Latest versions
- SDDP 17.3.5
- Download (Windows | Linux)
- Release site
- SDDP 17.2.12
- Download (Windows | Linux)
- Release site
- Detailed release notes
Learn more
- More information in the product sheet
- Contact us at sddp@psr-inc.com
LONG TERM EXPANSION PLANNING
OPTGEN
Overview
OptGen is a long-term expansion planning model that determines the least-cost sizing and timing decisions for construction, retirement and reinforcement of generation capacities, transmission network and natural gas pipelines. Several types of projects are available to be contemplated by the model:
Beyond that, OptGen becomes suitable for different types of power system expansion studies, from the moment that it provides a powerful set of flexible modeling feature. The model allows, for example, the definition of study horizons up to several decades, considering the project’s payment schedule, lifetime, and construction time. It also offers the possibility to incorporate several expansion policies and assumptions, according to the planner’s criteria, such as:
Modeling aspects
The integrated expansion is formulated by OptGen as a large-scale mixed integer programming problem and the solution is obtained using advanced MIP techniques and Benders decomposition.
These following features are used on the formulation:
- Flexibility of investment & operation steps (year, semester, quarter, month);
- Investment decisions represented either by integer or continuous variables;
- Optional and obligatory projects;
- Sets of associated projects;
- Sets of mutually exclusive projects;
- Precedence constraints;
- Minimum capacity constraints for different groups of technology and for different time intervals allowing to represent governmental energy policies;
- Reference marginal cost calculation;
- Environmental constraints: emission of greenhouse gases;
- Fuel availability constraints;
- Multiple scenario analysis;
- Analysis of a complete or partial expansion plan defined by the user.
OptGen aims to deliver consistent results that help both, (i) planners in the expansion decision making process and also (ii) market players, so that they have the best possible view of the system expansion. Based on the state-of-the-art methodologies, the model offers potentially efficient options for solving this problem:
- Optimization procedures, such as the rolling horizon and the horizon year solution strategies
- Analysis and reinforcement of user provided expansion plans
- Graphical dashboard tools to analyze macro operative results
Check the main components of the OptGen model in the figure below and read the topics of each one with the explanation to understand even more.
SDDP – Operation Module
OptGen optimizes the trade-off between investment costs to build new projects and the expected value of operative costs obtained from SDDP, the transmission-constrained multistage stochastic dispatch model. This integration enables OptGen to take advantage of all SDDP’s features to represent an electrical system while solving the operative dispatch. This includes, among others, detailed modeling with hourly or intra-hourly resolution, demand response to price signals, uncertainty sources representation such as:
CORAL – Supply Reliability Evaluation
The integration with CORAL – the reliability analysis model that it’s based on Monte Carlo simulation – enables both system and bus-level indexes, such as LOLP, LOLE, EPNS, to be evaluated for each proposed expansion plan. Moreover, minimum security level constraints can also be incorporated into the optimal expansion process, allowing OptGen to make expansion decisions respecting reliability requirements.
DPR – Dynamic Probabilistic Reserve
The idea of the Dynamic Probabilistic Reserve is to guarantee the supply of electricity through secondary reserves, not only in the event of demand variability or largest unit failure, but also the variability caused by Variable Renewable Energy sources (VREs).
OptGen is the only tool in the market capable of co-optimizing Generation, Transmission and Dynamic Probabilistic Reserves and, therefore, while using OptGen, it is possible to co-optimize flexibility-related investments such as batteries or pumped-hydro-storage (related to probabilistic dynamic probabilistic reserve requirements) and energy-related investments.
Use of OptGen
- SEETEC project for the study of the development plan and benefits of the regional energy market in the Balkan region for 2003-2010. (8 countries interconnected, 30 GW of energy demand and 5 GW of projected increase in demand for 2010);
- Venezuelan plan for expansion of generation and transmission for 2002-2010 (20 GW of installed capacity – 65% hydro – and 10 interconnected regions);
- Expansion study for the Brazilian system 2004-2015 (85 GW of installed capacity – 85% hydro, 27.5 GW projected increase in demand for 2015, 117 hydro plants, 108 thermal plants and 9 interconnected regions).
- It has been used by planning agencies (e.g. CEAC, from Central America), companies and consultants (SNC Lavalin, Electricité de France and others) in expansion studies in several Latin American countries (Bolivia, Ecuador, Colombia, Chile, integrated planning of the six countries of Central America and others); Balkan region; Africa (Tanzania; interconnection of Egypt, Sudan and Ethiopia); and Southeast Asia (interconnection of the Mekong River countries: Laos, Cambodia and Vietnam) and others.
Learn more
- More information in the product sheet
- Latest release site
- Full changelog
- Contact us at optgen@psr-inc.com
- Download: OptGen 8.1
SHORT-TERM OPERATION SCHEDULE
NCP
The NCP is an operative optimization model similar to the SDDP, but more adapted to short-term simulations – with time intervals from 15 minutes to 1 hour and with a weekly or monthly horizon. In addition to the variables and parameters represented in the SDDP, the NCP incorporates additional issues typical of the very short term, such as unit commitment, “ramping” of thermoelectric power plants, and water travel time.
In order to integrate long-term optimal operation with short-term optimal operation, the cadastral data and the future cost function of the SDDP can be imported by the NCP. In turn, the NCP data can be imported into other software that calculate power flows in networks, such as NetPlan. This integration is automatic in the ePSR environment.
Modeling aspects
The following aspects are modeled by the NCP:
- Demand balance equation at each bus, including quadratic losses in the transmission network circuits
- Linear power flow model, including capacity constraints on circuits for the base case and contingencies
- Water balance equation for cascade plants considering water travel time and wave propagation
- Minimum and maximum power restrictions for each plant, considering unit commitment decisions
- Minimum, warning and standby stored volumes for flood control in reservoirs
- Minimum and maximum effluent flow restrictions and restrictions on the rate of change of these flows
- Integration options with medium-long term studies: target generation, target volume and future cost function reading
- Restrictions of thermal plants: minimum operation and stop time, power ramps, fuel availability, number of starts
- Hydroelectric production modeled per unit based on the efficiency curve of the turbine-generator set, hydraulic losses, elevation of the tailrace and elevation x volume curve
- Security restrictions (primary and secondary reserve, circuit flow sum restrictions, generic generation restrictions, etc.)
The solution is achieved using advanced mixed linear-integer programming techniques.
System features
- Graphic interface in Windows environment;
- Includes module for preparing graphs with model results in MS Excel;
- Several results (ex: hydroelectric and thermal generation, marginal costs, flows in the circuits, stored volumes, etc.).
Application examples
- Cargo dispatch centers in Bolivia, Ecuador, Guatemala, El Salvador and Peru (daily and weekly operation schedule)
- Turkey’s biggest power generators with more than 30,000 MW
- Institutions from a number of Balkan countries in Southeast European Electrical System Technical Support project activities
- Agder Energi (Norway) to maximize revenue in the NordPool market
- Evaluation for use in the daily programming of the Brazilian electrical system (~5800 circuits, 3900 buses and more than 100 hydroelectric plants)
Methodology
Short-term operational optimization model (cost minimization or revenue maximization) (intervals from 15 minutes to 1 hour, weekly or monthly horizon) based on mixed integer programming, with detailed representation of hydroelectric, thermoelectric and renewable generation, transmission network with losses, unit commitment, water travel time, environmental constraints, reserves, steam extraction in thermals, coupling with medium-term models, etc.
It represents, in detail, hydroelectric systems (water balance for cascade plants, pumps, irrigation, etc.), thermoelectric plants (unit commitment, ramp restrictions, fuel flexibility, concave efficiency function), transmission network (Kirchhoff laws, losses quadratics, security constraints, etc.) and final condition at the end of the one-week stage (interface with the SDDP model). NCP is used in several countries in South and Central America by wholesale energy market operators (to determine the hourly price) and System Operators (real-time dispatch interface).
NCP determines the operation of a hydrothermal system with transmission restrictions in order to minimize production costs or to maximize revenues from the sale of energy to the market. Costs include the use of fuels (variable cost of production and start-up), cost of deficit, penalties for violating operating restrictions, among others.
Related downloads
The following files require a password for installation.
- More information in the product sheet
- Latest release site
- Contact us at ncp@psr-inc.com
- Knowledge Hub
- Download: NCP 5.28
TRANSMISSION EXPANSION PLANNING
NETPLAN
NetPlan is an integrated computational environment for transmission network planning and analysis which includes:
- data management tools (data editing, external data importation)
- study management resources (data coherency checking and chronology)
- visualization resources for the network and study results (schematic diagrams, circuit flows, overflow indicators, expansion plan cost, load marginal cost, contour plots)
- graphical interface that allows interaction with different modules
The following modules are available in the NetPlan environment:
- OptNet, for optimization of expansion planning of high voltage transmission network
- PSRFlow, for AC and DC transmission network analysis
- OptFlow, for AC and DC transmission network analysis of reactive power resources (VAr)
- OptVar, for planning of reactive power resources (VAr)
- Tariff, for allocation of transmission costs among generators and loads
All models use optimization tools specially designed to solve large scale networks.
The OptNet module – Transmission expansion planning
Modeling Aspects
OptNet models the transmission expansion planning as a MIP problem with the following features:
- Representation of linearized power flow model for the transmission system
- Representation of generation dispatch scenarios produced by SDDP model in order to account for uncertainties in load and generation production (hydro plant inflows and renewable resources)
- Decisions on new transmission facilities: AC transmission lines, transformers, series capacitors and dc transmission system
- Representation of project constraints: sets of associated projects, sets of mutually exclusive projects and precedence constraints
- The expansion process can be applied considering all circuits in operation (base case) as well as to selected single circuit contingencies
- Outputs include the expansion plan decided by the model and detailed operating results that can be graphically displayed in the network diagram and\or visualized using Excel spreadsheet
Solution methodology
The objective function consists in minimizing the investment cost to install new facilities and the supply reliability cost, providing the best investment x supply reliability cost trade-off solution. The solution of the mixed integer optimization program is provided using advanced techniques of mixed integer programming.
The methodology combines a heuristic method, that guarantees a feasible solution, with a Benders decomposition method that provides an optimal solution when the convergency is reached. Dispatch scenarios and contingencies are dealt by an incremental expansion strategy which makes the algorithm suitable to be used in planning studies of large networks with high penetration of renewable generation.
The PSRFlow module – AC and DC transmission network analysis
Modeling Aspects
- Applications designed for steady state analysis of transmission network
- Includes a conventional AC and DC power flow and contingency analysis
- Integration with generation dispatch scenarios produced by SDDP model
- Outputs include detailed operating results that can be graphically displayed in the network diagram and\or visualized using Excel spreadsheet
Solution methodology
The power flow application solves the load flow equations by use either a fast decoupled or a conventional Newton Raphson method, for AC and DC controls. Linearized power flow is also available.
The contingency analysis application processes a list of contingencies with the objective to detect and report network violations (circuit flow, bus voltage, etc.)
The OptFlow module – AC and DC transmission network analysis of reactive power resources (VAr)
Modeling Aspects
The OptFlow module is the computational tool for AC and DC transmission network analysis of reactive power resources with the following features:
- Representation of different generation and load scenarios produced by SDDP model to capture uncertainties in renewable sources (hydro inflow, wind, solar)
- Modeling of the non-linear active and reactive power balance of each node of the electric grid (Kirchhoff laws)
- Modeling of different network operation limits: voltage magnitude, active and reactive power flow transportation in the circuits, transformer taps, shunt, svc
- Outputs operating results can be graphically displayed in the network diagram and\or visualized using Excel spreadsheet
Solution methodology
The objective function considers the minimization of the sum of allocation of reactive power injection in the buses (to detect deficit of Var and its location in the network) together with the penalized deviation of the active power generation setpoint.
Decision variables include active and reactive power generation of the units, bus voltage angles, transformers taps, and capacitor/reactor susceptance.
The solution methodology consists in applying a robust primal-dual interior point algorithm for each represented scenario. The solution provided by the model guarantees the operation limits and constraints are obeyed for each generation and load scenario and identifies possible VAr deficiencies and their location in the network.
The OptVar module – Planning of reactive power resources (VAr)
Modeling Aspects
The OptVar module is the computational tool for reactive expansion planning with the following features:
- Representation of different generation and load scenarios produced by SDDP model to capture uncertainties in renewable sources (hydro inflow, wind, solar)
- Representation of investment in shunt equipment as new reactive power resources
- Modeling of the non-linear active and reactive power balance of each node of the electric grid (Kirchhoff laws)
- Modeling of different network operation limits: voltage magnitude, active and reactive power flow transportation in the circuits, transformer taps, shunt, svc
- Outputs include the expansion plan decided by the model and detailed operating results that can be graphically displayed in the network diagram and\or visualized using Excel spreadsheet
Solution methodology
The solution methodology consists of a Progressive Hedging algorithm that determines an expansion plan in shunt equipment as new reactive power resources, interacting with the OptFlow module to solve each of the optimal power flow problems.
The objective function considers the minimization of the sum of shunt investment cost and the penalized deviation of the active power generation setpoint.
Decision variables include active and reactive power generation of the units, bus voltage angles, transformers taps, and capacitor/reactor susceptance (existent and candidate elements).
The investment solution provided by the model guarantees the operation limits and constraints are obeyed for each generation and load scenario, where all available reactive controls were considered.
The Tariff module – Power transmission cost allocation (coming soon)
Modeling Aspects
The Tariff module is a computational tool designed to promote the allocation of costs related to the transmission system infrastructure among its users (producers and consumers). To perform such a task, the Tariff is able to:
- Identify how producers and consumers use the system to allocate costs accordingly
- Allocate costs considering an extensive range of operating scenarios, making tariff calculations adherent to the real electrical system operation and planning
The Tariff is a powerful tool for the power sector agents with relevant aspects for:
- System planners and regulators that can use it to reveal the transmission expansion actual costs and promote cost allocation and determination of tariffs; or it can be used as a planning tool to evaluate different cost allocation methodologies and select the more adherent to the electrical system-
- Generator and consumers who seek to forecast future tariffs and costs-
Solution methodology
The Tariff model can adopt three different transmission cost allocation methodologies:
- The nodal: used by Brazil and UK to allocate transmission costs. It is based on the marginal impact generators’ and consumer’s injections have over the energy flow in transmission facilities
- The Average Participation Factors: commonly used to allocate costs in problems involving transport infrastructure. It traces the path of generators’ and consumers’ injections over the grid
- The Aumann-Shapley: based on the game theory concept, assures fair cost allocation, modeling the transmission business as a coalition in which each agent can optimize costs of energy transportation
Some recent applications
- Designing alternatives for the future development of the Chilean National Transmission System (horizon 2019-2040). NetPlan were used to optimize the expansion of the transmission network, considering the insertion of new energy resources (wind and solar) and batteries
- NetPlan were used to optimize the network expansion for the Brazilian system for the horizon 2035, taking in account a large degree of renewable energy sources (wind and solar)
- Analysis and regulatory proposals for the Ancillary Services for the Colombian systems, considering the insertion of variable energy renewable resources and new technologies in high and low voltage. NetPlan were used to study the expansion of the Colombian transmission system for the horizon 2019-2040
- Renewable integration of South America. NetPlan were used to optimize the transmission expansion (2017-2035) in nine South America countries, participants of the Andeans community (Chile, Colombia, Ecuador and Peru), Southern Cone (Argentina, Brazil, Paraguay and Uruguay) and Bolivia
- Expansion planning of the WECC transmission network for a 15-year horizon, peak yearly dispatch scenarios and 960 projects
- Analysis and regulatory proposals for transmission cost allocation mechanisms in Brazil. NetPlan was used to simulate the transmission tariff calculation using different methodologies in order to assess the impacts over tariffs of generators represented by the Brazilian Wind Power Association (ABEEólica).
Related downloads
The following files require a password for installation.
- More information in the product sheet
- Contact us at netplan@psr-inc.com
- Download: Readme
- Download: NetPlan 4.3
DEVELOPMENT OF HYDROELECTRIC AND PUMPED STORAGE POWER PLANT HERA (IVY)
HERA
HERA is a computational model developed by PSR to study the hydroelectric potential of watersheds, considering the economic viability of projects and their socio-environmental impacts.
The model aims to contribute to the decision-making process, which is generally very complex because it involves conflicting interests for and against the construction of dams. For this, a balance is sought between electricity production and environmental conservation.
HERA simulates the construction of hydroelectric plants, including the area flooded by reservoirs. The model scales structures according to the Eletrobras Hydroelectric Inventory and Hydrographic Basins Manual (different types of dams, spillways, powerhouses, channels, diversion schemes, tunnels, etc.) and calculates the corresponding costs (concrete, excavation of rock and soil, etc.). Calculations are made for candidate sites, considering a digital elevation model, or terrain. Then HERA adds the costs of electromechanical equipment associated with the capacity of the candidate project, and the socio-environmental costs, which are generally associated with the area flooded by the reservoir, including removal of vegetation, environmental compensations, relocation of affected infrastructure (roads, bridges, etc. .), as well as resettlement of the affected population.
Costs are calculated for each candidate project, each of which can be simulated with different hydraulic heads and engineering designs (evaluated from the combination of different types of structures and their positioning along the dam axis). A list of candidates is then prepared, from which the best combination will be selected by an optimization model. The mathematical model includes physical constraints of the system, such as water balance equations, operational limits, as well as socio-environmental constraints related to the impacts of the projects (number of families affected, flooded area, etc.).
HERA has been used by PSR in studies for The Nature Conservancy in watersheds in Colombia (Magdalena River), Gabon (Komo and Abanga Rivers), Brazil (Juruena, Ivaí Rivers) and Mexico (Coatzacoalcos). In Brazil, the National Electric Energy Agency (ANEEL) has shown interest in promoting its use in participatory inventory studies, where environmental agencies, public prosecutors, mayors, government institutions, project developers, indigenous groups and others can use the tool as part of a stakeholder engagement process to assist decision making. This would allow an objective evaluation of the alternatives, in addition to ensuring greater transparency and agility: a process that historically would take several months could be reproduced in a few hours with HERA, thus allowing an exploration of the alternatives in “real time”. HERA possesses several innovative aspects, for example:
1. Automation of geoprocessing functions oriented to the investigation of hydroelectric potential (calculation of the hydrographic network, simulation of reservoirs considering elevation x area x volume curves, regionalization of flow history, etc.).
2. Calculation of user-defined metrics based on geographic information (maps in shapefile format), which are used to estimate the impacts of each project individually in combination with other projects.
3. Automation of project design, including engineering design and cost estimation.
4. Possibility for the engineer to edit or modify dimensioning parameters: for this, an input and output data dictionary is used. The parameters (for sizing the spillway, for example) can be edited in Excel. The new computational procedure is then “compiled” for execution into Python code incorporated into the HERA model.
5. Distributed computing (in the cloud) can be used in large watersheds.
6. Mathematical formulation that selects the best combination of projects in that watershed (in an effort to maximize the objective function value).
7. Export of results to other GIS software, Google Earth and others.
8. Integration with Revit for 3D visualization of structures.
9. Programming in Dynamo to build 3D models of hydroelectric power plants from individual components considering the digital elevation (or terrain) model.
10. Advanced architectural visualization of selected hydropower projects in Infraworks 3D.
Licensing information
Please contact hera@psr-inc.com for more information on commercial licenses.
HERA is free for non-profit organizations.
HERA is the result of a research and development project under Aneel’s Research, Development and Innovation Program. Below is a list of the R&D projects related to HERA and their respective supporters:
1- ANEEL R&D 0678-0113/2013: HERA – Supporter: EDF Norte Fluminense
2- ANEEL R&D 0678-0116/2016: Environmental Assessment and Engineering Arrangements (Interface and 3D) – Supporter: EDF Norte Fluminense
3- R&D ANEEL 00678-0120/2020: Reversible Module – Supporters: CTG Brasil, Elera and Light
![]()
![]()
![]()
Please contact hera@psr-inc.com to request a free license.
Related downloads
The following files require a password for installation.
Saiba mais
MODELING OF NON-CONVENTIONAL RENEWABLE RESOURCES
Time Series Lab (TSL)
Time Series Lab (TSL) is a renewable modeling tool that produces synthetic scenarios for future generation of Variable Renewable Energy sources (VREs). TSL has two main modules: (i) TSL-Data; and (ii) TSL-Scenarios:
- TSL-Data: creates a 40-year “synthetic” hourly historical record by processing the information available in the global reanalysis database;
- TSL-Scenarios: generates future ERV scenarios considering the temporal and spatial correlation with hydrological flows;
To estimate the statistical model, TSL-Scenarios needs a historical record of the generation of ERVs, which can be a complicated task depending on the region. Therefore, TSL has two main modes of operation:
- Users can enter actual historical data records
- TSL-Data can create a “synthetic” 40-year historical record based on wind speed and solar irradiation data from the reanalyses database.
Creating a historical record of renewable generation
TSL calculates wind production through a model based on the Virtual Wind Farm (VWF) methodology. The following parameters are used to convert wind speed into energy:
- The turbine power curve
- Turbine height
- The plant coordinates (to download wind speed data)
Solar output is based on Global Horizontal Irradiance data, i.e. the irradiation at the top of the atmosphere and the temperature extracted from the reanalysis database. Taking this information into account, the GSEE (Global Solar Energy Estimator) method is applied. The following parameters are considered in the energy conversion:
- The solar panel tracking system
- The tilt angle of the panel
- The coordinates of the solar plant (to download solar irradiation and temperature data)
Location of “hotspots” for generic projects
In addition to providing tools for creating “synthetic” historical records of renewable generation, TSL provides a tool for finding “hotspots” for generic wind and solar energy projects. For this, the following tools are available:
- Wind speed map for the whole world
- Solar irradiation map for the whole world
- Protected areas around the world
- Possibility to load user-defined custom maps
Generating synthetic renewable generation scenarios correlated with flows
Due to the spatial correlation of wind and solar production in different regions, as well as the spatial correlation between streamflow and wind speed series in others, the TSL represents the joint probability distribution of all non-conventional renewable resources and hydropower plants, both for existing and future plants.
The Bayesian Network is a statistical model that can produce synthetic scenarios, capturing the most significant correlations existing in historical data. This methodology has the following characteristics:
- Produce scenarios considering a joint probability distribution
- Nonparametric estimation of the probability distribution of each plant
- Maintains historical spatial and temporal correlations in synthetic scenarios
- Keeps the original probability distribution of historical data
In summary, due to the high variability and intermittency of this type of resource, TSL generates these scenarios with the following characteristics:
- Hourly resolution
- Nonparametric estimation of probability distributions
- Bayesian network methodology to capture spatial and temporal correlations between ERVs and hydrological flows
Related downloads
The following files require a password for installation.
Saiba mais
ECONOMIC AND FINANCIAL EVALUATION OF GENERATION PROJECTS
OPTVALUE
The OptValue model is a tool for the economic and financial evaluation of generation projects based on the search for an internal rate of return compatible with the risk associated with the construction and operation of the plant. This allows the comparison os different generation technologies from a risk x return perspective.
The model is based on calculating an energy price such that the internal rate of return (IRR) for shareholders associated with the project will be above a value at a certain pre-established VaR level (e.g. with probability that 95% the IRR will be above 15%). This calculation involves the investment cost of the plant, the “project finance”, type of contract for the sale of energy, taxes and sector charges, uncertainties associated with hydrology, investment costs, construction time, regulatory aspects, etc.
The program outputs are:
- Project energy price compatible with a given minimum value for the shareholder’s IRR at a pre-established “Value at Risk” (VaR) level or an expected value of the shareholder’s IRR;
- Probability distribution for the shareholder’s IRR;
- Probability distribution for net and discounted project revenue;
- Optimal contracting level for hydraulic power plants;
- Cash flow probability distribution;
- Breakdown of energy price into: Investment costs, taxes and sector charges, O&M costs, fuel costs, etc.;
- Time series graphs associated with power plant generation, revenues and expenses at CCEE, net revenue for shareholders, etc.
The risk x return tradeoff associated with projects is established in terms of the standard deviation versus the expected value of the IRR.
Related downloads
The following files require a password for installation.
Saiba mais
MANAGEMENT AND OPTIMIZATION OF ENERGY PORTFOLIOS
OPTFOLIO
Analytical tool for managing and optimizing energy portfolios composed of physical assets (hydroelectric, thermal and renewable plants) and financial assets (forward contracts, derivatives and others). OptFolio uses integer programming and stochastic optimization techniques to build contract portfolios from a risk-return perspective using risk indices (such as CVaR and utility functions) and has been used in commercial studies in Brazil and abroad (Turkey) for optimization of energy contracts and integrated commercialization of renewables.
Optfolio – optimal mix of physical and financial assets considering spot price scenarios, energy production and associated risk constraints. OptFolio has been used by clients in Europe to determine the optimal dispatch / contracting strategy in short-term markets, and in Latin America to optimize the portfolio of multinational assets to generate international investors.
The OptFolio model is a decision tool for managing energy portfolios, including physical assets such as power plants and financial assets such as bilateral contracts and other electricity derivatives.
The objective is to maximize the present value of net cash flow for a given firm. There are several sources of costs and revenues that are calculated by Optfolio in the composition of the net cash flow:
- Generation costs, transmission tariffs, other fixed costs, taxes, financial costs associated with acquired contracts and derivatives, and investment costs associated with the construction of new plants;
- Financial income from sales of energy contracts and other derivatives;
- Revenues from energy sales in the short-term market where there are uncertainties regarding prices.
The program determines optimal investment decisions in physical assets (i.e. construction of new plants) and financial assets (i.e. purchase or sale of contracts or other derivatives). Risk constraints in terms of “Value at Risk” (VaR) such as a minimum revenue requirement at a risk level may be considered.
The model has three options for the objective function:
- Maximize the expected value of net revenues;
- Maximize the expected value of the utility function;
- Maximize minimum cumulative revenues at specified time intervals and across a set of hydrological scenarios.
The model represents the following aspects:
- Mandatory projects and set of mutually exclusive projects;
- Hiring limits;
- Investment restrictions;
- Risk restrictions in terms of “Value at Risk” – VaR;
- Internal rate of return associated with each scenario.
- Solution Approach
- The problem is formulated as a mixed integer programming problem.
Related downloads
The following files require a password for installation.
Saiba mais
CORPORATE SYSTEM FOR THE MANAGEMENT OF ENERGY STUDIES
ePSR
ePSR is a corporate computing environment designed to facilitate the collaborative development of energy studies. With a design strongly centered on a commonly used database, the ePSR architecture integrates PSR models, and can be extended to integrate third-party products.
ePSR adopts the “workbench” philosophy: all information and models are available in a relational database. Resources are made available to users through a graphical interface that has a user authentication and authorization scheme. Based on the registered user profile, the scheme allows configuring which resources will be available. Developed with the most advanced information technologies, ePSR offers numerous corporate facilities that increase the organization and productivity of studies. These can be as diverse as scheduling the next hour’s operation or energy planning with a 20-year horizon.
ePSR General Architecture
ePSR was developed in an architecture composed of a graphical user interface; business rules; data access rules; data access functions; database management system, stored data, applications (templates) and data format converters.
Information Resources
The information contained in the ePSR Database is organized into five main categories.
- Power System Components – describe the components of the generation and transmission system. Some components are constant while they may vary over time. Components are versioned. This means that the state of the profile for any moment in time can be reconstructed from the Database. This feature is useful for auditing activities and reproducing previous simulations and studies.
- Configurations – represent the organizations of the power system. Configurations are defined by grouping power system components into interrelated sets.
- Time series – represent historical data and predicted scenarios.
- Constraints – operative rules that restrict power dispatch.
- Study Management – manage studies stored in the Database. A study is built from the selection of available information from configurations, historical data and forecast scenarios from the Database. Application specific parameters are required to execute a desired model. At the time of creating a study, all information available in the ePSR Database is available, even those defined by other users.
Energy Models
ePSR integrates a suite of PSR templates for:
- Medium and long term planning (SDDP)
- Short term power dispatch planning (NCP)
- Generation Expansion Planning (OptGen)
- Transmission Expansion Planning (NetPlan)
- Economic Evaluation and Risk (OptValue)
ePSR can also be integrated into real-time SCADA systems.
Geographic Representation
The Power System components in the ePSR can be associated with a geographic location (geo-referenced), expressed through geographic coordinates (latitude and longitude).
Geo-referenced components can be visualized on a map using one of three background map options:
- Open Street Map
- Bing map
- Google Satellite Image
Technical Reference
- Operating System: Windows
- Graphic Interface: .Net Desktop
- Database: Oracle DBMS
- Web Server: Microsoft IIS
- Format for data exchange: Web Services and XML
Related downloads
The following files require a password for installation.
Saiba mais
CLOUD COMPUTING TOOL
PSR Cloud
The problem of electricity generation has changed from private systems – local to the regions where they were intended to supply demand – to meet global demands from large generators, located at strategic points and supported by a distribution network of great capillarity. Similarly, we are at a time when high-performance computing, which implies high costs for hardware, software and specialized personnel, is leaving corporate data centers and migrating to first-class data centers. They offer processing power, bandwidth, power provision, support, hardware and software investments at an unmatched cost. This modality of computing is called cloud computing.
PSR has developed a platform to manage the remote execution of hydrothermal dispatch simulation models in a distributed processing environment, so that users do not need to have the necessary infrastructure to achieve the same goal. This platform is called PSR Cloud and currently has thousands of processors.
Data communication (input and output files of the models) is carried out between the user’s local computer and the remote servers allocated for execution, without any interference or passage through PSR’s servers.
PSR Cloud is billed as a pay-per-run service on a prepaid basis. In prepaid mode, the user acquires credits to be used in executions. The cost of each round is accounted for and deducted from the current balance.
How reliable is the service?
Computing capacity is provided through PSR’s relationship with Amazon.com. Amazon has emerged as an important global supplier of processing capacity, having one of the largest data centers in the world. Amazon’s platform availability meets the most stringent international standards and is currently the largest capacity provider on a global scale.
PSR recently had their solution reviewed and published by Amazon as a case study. See details at: http://aws.amazon.com/solutions/case-studies/psr/
In addition, PSR was certified by Amazon, receiving the title of Solution Provider. Details can be found at: http://www.aws-partner-directory.com/PartnerDirectory/PartnerDetail?Name=PSR
How to begin using the service?
Installing PSR Cloud is straightforward. Initially, it is necessary to download and install the PSR Cloud Client module.(*)
Activating the user in the service, after installing the program, is very simple: the user registers on our portal, creating a login and password. Following that, the user will send the login created to psrcloud@psr-inc.com for the account to be activated.
When opening the PSR Cloud Client, the user will add their cases, selecting for each one of them through a simple and intuitive interface:
- The model that will run (SDDP or NEWAVE – the user must have a license for the model that will be used),
- The number of processors to be employed,
- The directory on the local computer where the case data is located (and where the results will go after the run)
When commanding the execution, the input data are automatically sent to the servers allocated in the clouds for execution and from where, after the execution, the output files will be downloaded to the local directory.
Send an email to psrcloud@psr-inc.com with any questions you may have about the service.
(*) It is necessary to install the following dependency:
Microsoft .NET Framework Version 4.0
Related downloads
The following files require a password for installation.
Saiba mais