







This article is organized into two parts:
Part 1 — PSRCast in energy analytics
The first part is based on a recent presentation delivered at the DTU PES Summer School in Denmark. It provides a comprehensive overview of PSRCast, PSR’s AI-based scenario generation tool, and its integration with analytical tools such as SDDP.
The links to the material presented by Luiz Barroso and the corresponding video are below:
Presentation: https://www.psr-inc.com/get/2026-05LuizBarrosoDTUSummerSchool.pdf
Video: https://www.youtube.com/watch?v=p7CLXFiqxCU
Part 2 — Applications beyond energy planning
The second part, written by Julio Alberto Dias and Mario Veiga Pereira, is adapted from a recent edition of PSR’s Energy Report (https://www.psr-inc.com/en/energy-report/). It describes additional applications of PSRCast to agricultural insurance, sanitation and other areas, and discusses AI-based modeling of extreme events, which requires methodological adaptations compared with standard PSRCast modeling. A recent podcast complements this discussion: https://www.youtube.com/watch?v=U-7HrFSMSIg.
Among the various fronts of application of AI, climate modeling is today one of the central topics of greatest strategic interest. Whether improving forecasts, reducing biases in physical models, generating synthetic scenarios, or identifying complex patterns in large databases, machine learning techniques have significantly expanded the capacity to extract useful information from climate systems.
This movement gains additional relevance in the context of climate change. In a stationary environment, in which past behavior would be a good guide for the future, statistical models based exclusively on historical series could provide reasonable answers to various planning problems. However, the current climate system is in transition. Changes in atmospheric circulation, in the frequency of extremes, and in the ocean-atmosphere interaction make the hypothesis that the recent past adequately represents future conditions increasingly fragile. In this scenario, methods that simply reproduce historical patterns tend to become insufficient to capture new risk settings.
At the same time, the digital revolution has significantly expanded access to climate information. Projections from multiple global circulation models (GCMs), developed by different research centers, institutes and laboratories around the world, are now widely available. High-quality multi-model ensembles and reanalysis databases offer an unprecedented volume of climate system data. The challenge, therefore, stopped being the scarcity of information and became the ability to integrate it, interpret it and translate it into consistent and usable scenarios for decision-making.
Given the strong dependence of the electricity sector on weather conditions, PSR developed the PSRCast: an AI model designed with the objective of transforming projections of global circulation models into plausible scenarios of water resources, of the availability of variable renewable generation and of demand, consistent with the needs of operation and energy planning. It is structured to capture these relationships probabilistically, building a robust scenario generator, conditioned to global climate signals.
The following figure shows the architecture of the PSRCast.
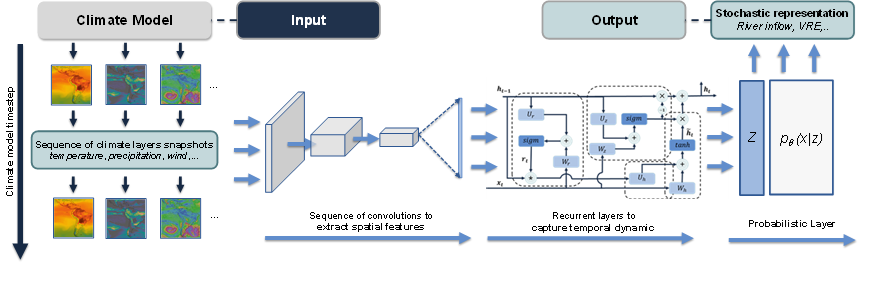
As shown in the figure, the PSRCast is a Deep Neural Network (DNN) with three layers, where the input to the training set are the predictions of the GCMs and the outputs are the real events. This architecture allows the generation of thousands of climate scenarios in periods ranging from 15 days to ten years. PSRCast emulates the behavior of GCMs, but it can run thousands of times faster.
PSRCast applications
- New climate-related energy planning and operation strategies for Brazil, Colombia, Mexico, Costa Rica, and other countries
- Assessment of the climate impact on the reliability and prices of electricity supply (various customers)
- Supply risk assessment for a water utility
- New guidelines for climate risk reporting from utilities (partnership with BTG)
- Climate risk assessment for agricultural insurance
- Scenarios of extreme weather events of rain and wind gusts
As mentioned, PSRCast applications for energy were presented in an earlier edition of the Energy Report. Below we will show the last two applications on the list: agricultural insurance and extreme weather scenarios of temperature and wind.
Agricultural insurance
The PSRCast architecture goes beyond the specific application to the electricity sector; it can learn the relationships between GCMs projections and any quantity derived from these climatic signals. In this context, its performance can be understood as a probabilistic “downscaling” process, which translates the large-scale signals from global models to the scale of interest, adjusts structural biases in relation to the observed, and explicitly incorporates the uncertainty of the process.
One of the recent applications to which PSR has been contributing is the projection of agricultural crops, whose productivity over the cycles is strongly dependent on weather conditions. Variables such as maximum and minimum daily temperatures, accumulated solar radiation, wind and precipitation have a direct influence on crop development and constitute fundamental parameters in agronomic simulation models.
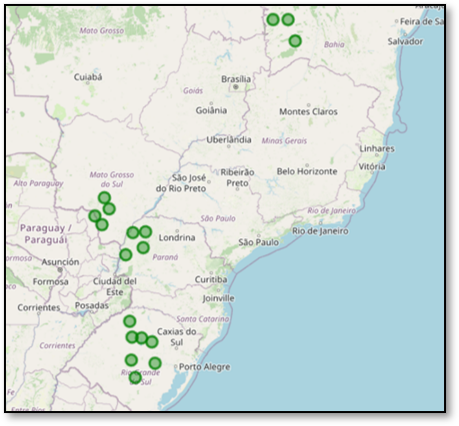
The following figure shows the geographical location of the regions analyzed in the context of this activity. The wide spatial distribution highlights the diversity of climatic dynamics involved, as well as the variety of agricultural crops considered, such as soybeans, corn and others, each with specific sensitivities to weather conditions.
In this application, the objective of the PSRCast is to generate hundreds of scenarios with daily resolution and a one-year horizon for a set of meteorological variables at all the points analyzed.
These scenarios are constructed in such a way as to preserve not only the individual statistical patterns of each variable, but also the spatial and temporal correlations between them, as well as other dependency structures that influence the development of crops throughout the production cycle. As mentioned before, the difference between PSRCast is that it does not use historical records to generate scenarios, because due to climate change, the past is no longer a representative reference for the future. And as readers can imagine, having the correct probability distribution of next year’s events is critical to calculating agricultural insurance premiums.
In the following figure, examples of retrospective projections for the harvest cycle that began at the end of 2022 are presented, with the objective of illustrating, in a general way, the scenarios that would have been projected by the PSRCast compared to the values observed throughout the cycle.
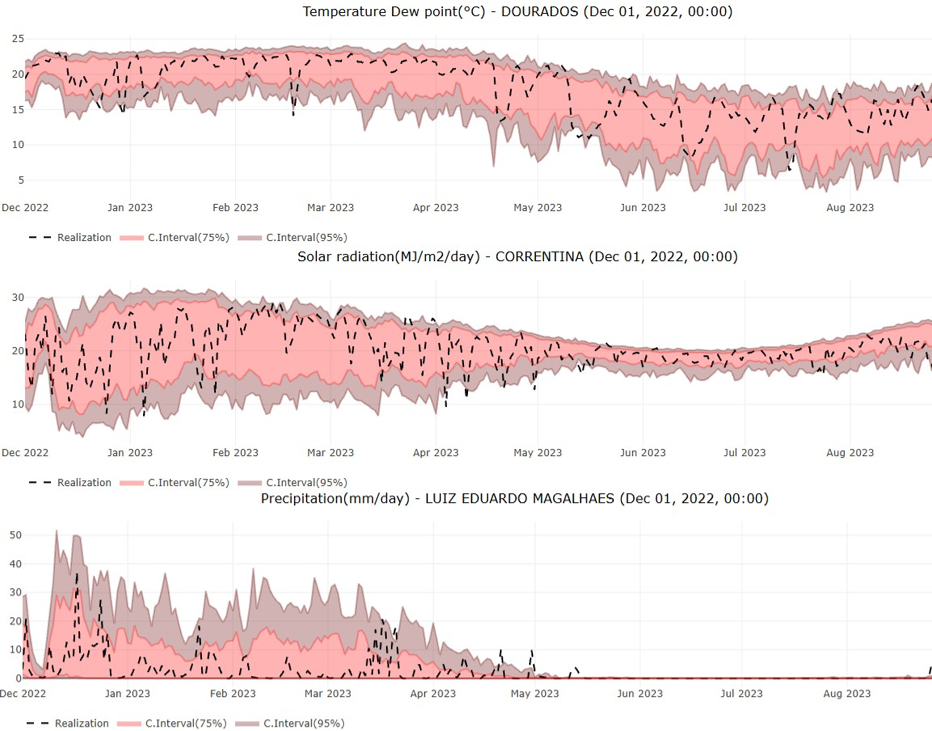
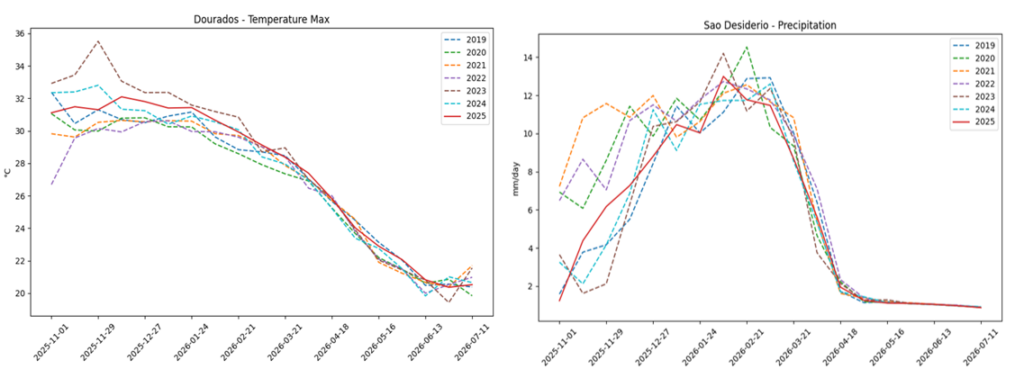
It should be noted that, in the context of long-term projection, retrospective analyses not only serve to diagnose the adequacy of the model in the construction of consistent scenarios, but also to enable comparisons between the current projection and recent years. This approach allows a relative quantification of projected conditions compared to the recent past, providing an additional reference for interpreting risk and making decisions about the insurance premium.
This type of comparison is exemplified in the figure below.
These scenarios can then directly feed crop simulation models to estimate productivity. Because the scenarios generated preserve the natural statistical characteristics of the meteorological variables, as well as their spatial and temporal dependencies, they provide coherent and physically consistent inputs for these tools.
Risk of extreme rainfall
Extreme rainfall events are among the main risk factors for the Brazilian electricity sector. Heavy and persistent rains directly impact dam safety, spill management, the integrity of civil structures, and the reliability of transmission and distribution systems. In scenarios of high climate variability, the ability to anticipate increases in the probability of extreme events becomes not only an analytical advantage, but a central element of risk management and the preservation of operational safety, especially in the current context in which we have already felt the impacts of climate change.
On the short-term horizon, that is, the next few hours or a few days ahead, the risk of extreme precipitation events is reasonably well anticipated by high-resolution regional weather models. These models explicitly resolve the dynamics of the atmosphere and its interaction with the surface with high spatial and temporal detail, making it possible to identify the formation and evolution of intense convective systems with good predictive capacity. At this scale, the combination of detailed physics and frequent assimilation of observational data provides a solid basis for weather alerts and immediate response actions.
The challenge shifts when the focus is on the quantification of risk over longer horizons, coming months, for example, in which strategic decisions must be taken under structural uncertainty. In this context, the analysis ceases to be a problem of deterministic prediction of a specific event and becomes an assessment of changes in the probability profile of extremes.
In a hypothetical scenario of unlimited computational capacity, it would be possible to probabilistically monitor the risk of extreme events by simulating a virtually infinite number of plausible atmospheric trajectories. Each trajectory would evolve according to the same physical equations used in meteorological models, allowing the probability distribution of extreme precipitation to be directly estimated based on the frequency of occurrence in the different simulated scenarios. In practice, however, computational limitations make it impossible to build ensembles of this magnitude, especially over a period of weeks to months. As an alternative, statistical approaches have been used to characterize the behavior of extremes, such as extreme value analyses (GEV models and Peaks-over-Threshold approach with Generalized Pareto distributions), adjustment of parametric distributions to the tails of historical series, in addition to methods based on resampling and stochastic generation of synthetic scenarios. While useful, these strategies rely heavily on structural hypotheses and tend to capture in a limited way the nonlinearity and multiscale dynamics that govern the occurrence of extreme events.
AI for extremes: same, but different.
At first glance, it may seem that structural monitoring of the risk of extreme precipitation events is just a natural extension of the AI model for generating long-term scenarios presented earlier. After all, if we can generate prospective scenarios for variables such as temperature, precipitation, wind, and flow, it would be sufficient to assess the distribution of these scenarios and extract the probabilities associated with the most severe events.
However, although there are methodological similarities, the nature of the problem imposes conceptually distinct challenges.
Briefly, two central peculiarities stand out. The first is the need to explicitly incorporate extreme event theory concepts into modeling. By definition, extreme events are rare, and their representation in historical data is limited both in frequency and in the diversity of atmospheric configurations. Models trained predominantly to reproduce average patterns or central distributions tend to underrepresent tails, precisely where the most critical risk resides.
The second peculiarity relates to the very nature of the rainfall projections over months’ horizons. Ensembles derived from global circulation models are generally adequate to characterize average anomalies and expected seasonal patterns, functioning well as “drivers” for aggregated hydrological and energy projections. However, these ensembles were not designed to faithfully represent the physics associated with localized and intense extreme events.
In a previous edition of the ER, it was shown that the representation of extreme temperature and wind events with the support of AI can be understood intuitively (and simplified) by the following analogy: it is a process like the use of super-resolution models in images and videos. Just as AI algorithms learn to transform a low-resolution film into a sequence of sharper and more detailed “photographs”, preserving spatial and temporal coherence, models trained on climate model outputs can learn to refine temperature and wind grids, converting low-resolution atmospheric fields into more detailed representations. As these variables are states dynamically solved by the fundamental equations of the atmosphere, the “scaling” process tends to preserve coherent physical structures, allowing the most faithful reproduction of local extremes.
For example, this increased spatial “resolution” is being used to model wind gusts that can knock down transmission towers, in an ongoing R&D project.
However, modeling extreme rainfall requires additional care. The reason is that, in GCMs, precipitation is not a variable solved directly by the primary physical equations, but a product derived from multiple parameterizations. This changes the nature of the problem, because the simple spatial refinement of the rain field does not guarantee the consistent reconstruction of the physical mechanisms associated with extreme events, requiring a conceptually different approach.
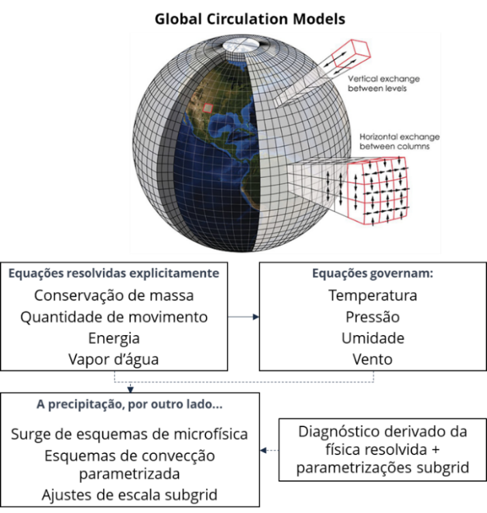
The long-term projection of precipitation is not the best explanatory variable for actual extreme precipitation.
Thus, instead of taking rain simulated by global models as a central explanatory variable, we can use an approach that shifts the focus to the atmospheric signals that precede and sustain the extremes. Monitoring is now conditioned by variables with greater synoptic predictability and greater structural stability, such as the total vapor content in the atmospheric column, the vertical movement at average levels of the troposphere, relative humidity at different pressure levels, and the winds not only on the surface, but also at specific atmospheric levels. Together, these fields represent the availability of moisture, dynamic vertical forcing, and organized steam transport, three fundamental physical pillars for the occurrence of extreme rainfall.
The following figure presents some of the main variables projected by global circulation models that help explain extreme precipitation events, as well as the degree of predictability of each one.

PWAT: Total water vapor content in the atmospheric column. Best indicator of maximum precipitation potential.
u850/v850: Zonal and southern components of the wind at 850 hPa. They represent organized moisture transport at low levels.
w500: Vertical air velocity at 500 hPa. Robust indicator of deep dynamic forcing associated with organized systems.
RH850: Relative humidity at 850 hPa. It controls moisture supply, but it is already under local influence;
w700: Vertical air velocity at 700 hPa. Useful for capturing convective intensification, but more sensitive to subgrid noise;
RH700: Relative humidity at 700 hPa. Additional information; greater variability and lower isolated robustness;
Pr: Precipitation forecast from the global model. Result of parameterizations; greater structural bias and lower robustness for specific extremes.
From this set of physically based conditionals, we can apply a Conditional Variational Autoencoders (CVAEs) architecture — the third layer of the PSRCast DNN, see previous figure — training them to generate consistent extreme precipitation scenarios at specific points of interest, preserving both physical coherence and observed statistical variability. With regard to the statistical representation, the structure of the CVAE must be adapted to more adequately reflect the asymmetric and intermittent nature of extreme precipitation. [1]
[1]Instead of assuming a traditional Gaussian parameterization, in which the latent space converges to a normal distribution, we propose a more sophisticated formulation, in which the generative process incorporates a Bernoulli—Gamma combination. In this configuration, the Bernoulli component explicitly models the probability of the event occurring (rain versus no rain), while the Gamma component represents the distribution of intensities conditioned by the occurrence. Conditional atmospheric variables simultaneously modulate these two mechanisms: they alter both the probability of activation of the event and the parameters that govern its magnitude.
This strategy makes it possible to separate two levels of uncertainty: (i) the uncertainty associated with the large-scale atmospheric state, coming from global model ensembles; and (ii) the uncertainty associated with “subgrid” processes and local variability, captured by the probabilistic component of the AI model.
This approach is particularly consistent with the foundations of extremes theory, as it recognizes the highly asymmetric, heavy-tailed, and weather-dependent nature that characterizes intense precipitation events.
The figure below presents an illustrative real example in which the model was calibrated to generate consistent rainfall scenarios in a dam in the south of the country.
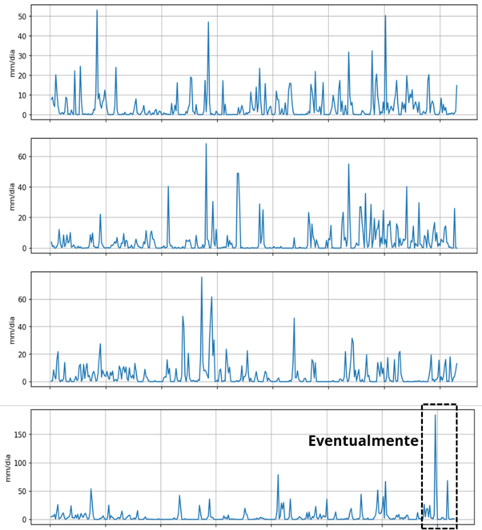
From different projected atmospheric conditions, it is possible to produce a massive set of daily rainfall sequences, allowing the construction of prospective risk distributions. These scenarios can be evaluated and compared to historical references and design parameters, making it possible to identify, for example, whether there are indications of an increase in the probability of occurrence of extreme events under current weather conditions or if the return times associated with critical rainfall considered when designing the dam remain adequately covered.
Use of DNNs and satellites to estimate water withdrawals for irrigation
The withdrawal of water for irrigation is very relevant information for the operation of the hydroelectric system. In a paper for Elera, PSR developed a methodology based on AI and information from electromagnetic spectra from the ground measured by satellites to accurately and automatically estimate this removal. The procedure is summarized in the following figure.
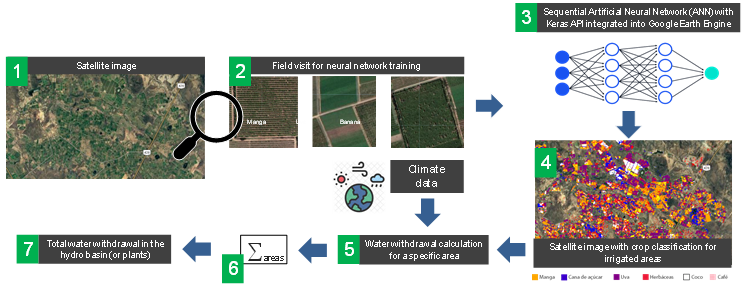
In a simplified way, spectral information makes it possible to identify each type of crop. This identification, in turn, makes it possible to calculate the water requirement. The final step is to estimate the need for irrigation by the difference between rainfall (produced by the PSRCast) and the need for water. The results proved to be quite accurate, and we are currently including the effect of evaporation from dams in the estimation and refining the measurements to shorter intervals. This information is of great importance for the better management of the so-called water energy food nexus, in the Northeast region.
Fire impact applications
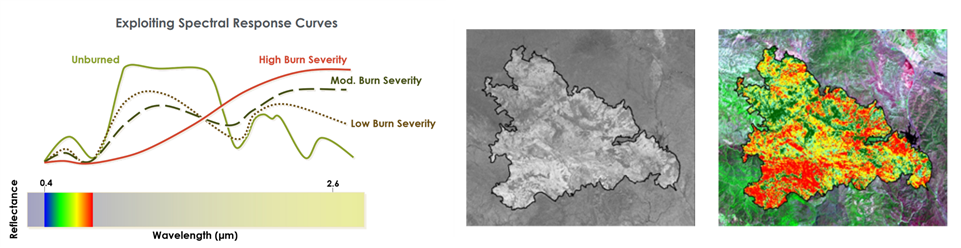
As in the case of PSRCast, seen earlier, the same AI framework can be used for different applications. As the following figure shows, an analogous spectral analysis was used to establish the actual damage to the sugar cane crops that burned down in 2025. The model correctly identified the areas where the cane was “scorched” and where it was burned. This, in turn, allowed a better estimation of the impact on sugar and ethanol prices.
Conclusions
The applications of AI to climate modeling have allowed a significant gain in quality and resolution for the analysis of probability distributions of events affected by climate change. As shown, these applications extend beyond the energy area.
AI techniques have also been shown to allow the representation of extreme events such as floods and gusts of wind. Modeling these events requires additional care, but the results are equally significant in many areas.
The third area is the combination of AI with satellite information. The breadth of the results has been demonstrated again, and their relevance will only increase in the future with the increase in satellite measurements.
Instead of assuming a traditional Gaussian parameterization, in which the latent space converges to a normal distribution, we propose a more sophisticated formulation, in which the generative process incorporates a Bernoulli—Gamma combination. In this configuration, the Bernoulli component explicitly models the probability of the event occurring (rain versus no rain), while the Gamma component represents the distribution of intensities conditioned by the occurrence. Conditional atmospheric variables simultaneously modulate these two mechanisms: they alter both the probability of activation of the event and the parameters that govern its magnitude.