


Indicators are essential tools for assessing the operation of an electric power system. They provide a clear and objective view of system operation, allowing operators and planners to ensure that system functions meet pre-established safety, reliability, and quality parameters. These indicators help identify inefficiencies, operational bottlenecks, and recurring failures—such as overloads, excessive losses, or curtailments of renewable generation—which might otherwise go unnoticed.
Moreover, indicators support decision-making by providing data-driven insights that guide corrective or preventive actions. Indicators are also critical for assessing whether investments, such as network reinforcements or the integration of new technologies like storage systems, are delivering the expected operational benefits.
By quantifying key attributes such as reliability, flexibility, and resilience, indicators allow for a deeper understanding of the system’s ability to compensate uncertainties or the variability in production or consumption, as well as recovering from disturbances (such as failures of generation units or transmission network circuits). In regulated environments, indicators also increase transparency and accountability among stakeholders. Ultimately, well-defined indicators are fundamental to ensure that the power system evolves in a secure, efficient, and sustainable way as it adapts to the challenges of the energy transition.
This section aims to present a detailed set of performance indicators designed to evaluate the health and operational performance of power systems. These indicators intend to address critical aspects such as reliability, flexibility and resilience, through a robust framework called SINAIS developed in collaboration with the Brazilian Power System Operator, ONS. The ultimate goal of calculating these indicators is to provide stakeholders with meaningful insights into Interconnected Brazilian System performance, support informed decision-making, and guide future improvements within the sector.
SINAIS – System of Indicators for Analysis of Interconnected Systems
The SINAIS framework designed to estimate reliability, flexibility, and resilience indicators for power systems is based on a suite of five distinct simulation models, each targeting specific performance dimensions. The first simulation model focuses on evaluating the system’s energy supply security, assessing reliability metrics related to demand supply. The second one calculates day-ahead operational flexibility indicators, while the third assesses the reserve flexibility by emulating the real-time operation of the power system. The fourth model examines system performance concerning reliability during peak demand conditions. Lastly, the fifth model measures system resilience and restoration capabilities following contingencies.
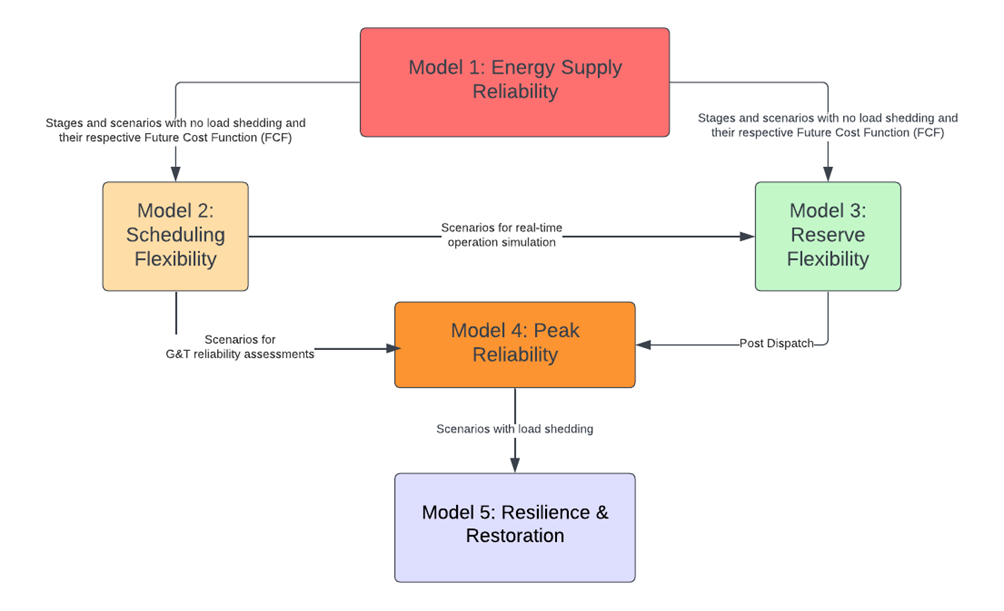
Following, detailed functional specifications for each model are provided, outlining the calculation of the indicators.
Model 1: Energy Reliability Indicators
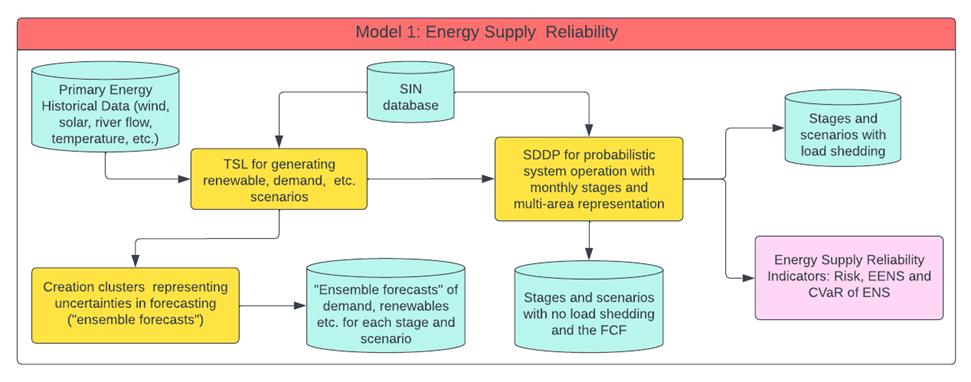
The methodology for estimating energy reliability metrics involves a combination of non-chronological and chronological simulation models using the Stochastic Dual Dynamic Programming (SDDP) approach. Initially, a multi-area, monthly-step non-chronological SDDP model with multiple load levels is applied over a horizon of interest. This model calculates the optimal operational policy considering uncertainties in renewable generation, inflows, and demand. Subsequently, a hybrid chronological SDDP simulation, with multiple load levels and weekly operational steps, is conducted. This allows capturing hourly variability while maintaining computational tractability.
Key reliability metrics derived from the SDDP results, including not only traditional indicators as the risk, and the expected value of energy not supplied (ENS) but also innovative measures as the Conditional Value at Risk (CVaR) of ENS, which captures the tail risk by focusing on worst-case scenarios beyond a specific percentile.
Flexibility Indicators
Two primary models are proposed to evaluate the operational flexibility of the electric system. The first, operational scheduling flexibility, relates to the system’s ability to meet the forecasted net demand – calculated as the total demand minus the generation from non-controllable renewables – using the controllable resources represented in the simulation.
The second model, called reserve flexibility, assesses the system’s ability to redispatch generation in real time, using planned operating reserves to accommodate uncertainties such as errors in demand forecasting and unpredictable renewable generation variability. To estimate these flexibility indicators, hourly dispatch problems are solved using a weekly horizon with SDDP. This results in hourly generation schedules for controllable resources and reserve allocations per generating unit.
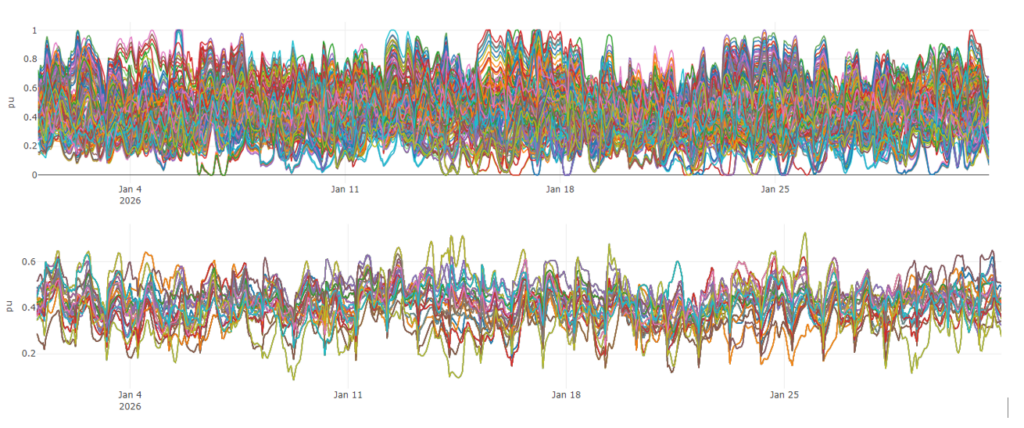
The methodology also accounts for the creation of ensemble forecasts representing real-time prediction errors relative to scheduled values. These ensembles, particularly for renewable generation, are clustered using k-means techniques to replicate the uncertainty profile observed in historical power system operation. This approach reduces the variance in forecast scenarios while maintaining representativeness, ensuring the flexibility indicators accurately reflect operational challenges. The graph below shows the renewable generation of a plant for 200 original renewable scenarios and the renewable generation of this same plant considering the ensemble forecasts, grouped into 20 clusters.
Model 2: Operational Flexibility Indicators
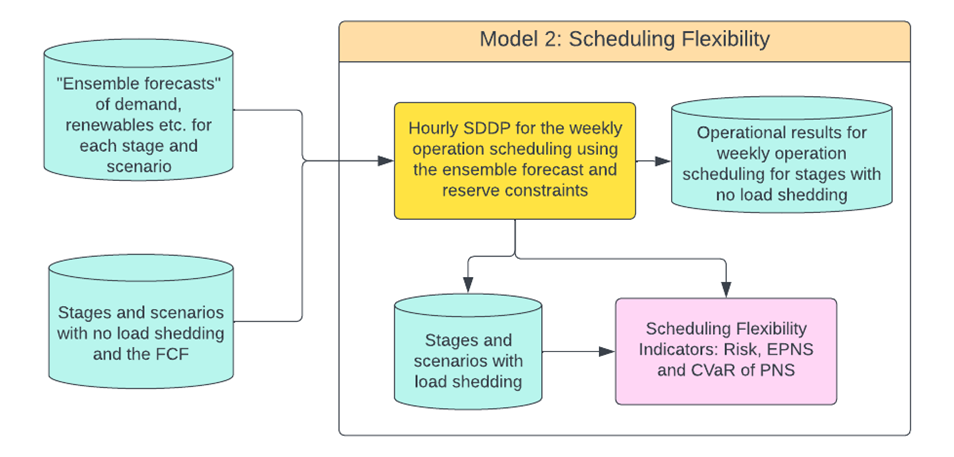
In this model, hourly dispatch problems are solved over a weekly horizon using SDDP. Based on the dispatch results, the upward and downward ramping available are calculated for each hour, considering the difference between the available controllable generation and the system’s net demand. The indicators in this model are related to the system’s ability to meet the forecasted “duck curve” (demand minus renewable generation) using controllable resources. This conceptually corresponds to a week- ahead operational scheduling.
Model 3: Methodology for Estimating Reserve Flexibility Indicators
The reserve flexibility indicators aim to emulate real-time system operation, specifically assessing whether the reserves scheduled during weekly operational planning are sufficient to accommodate deviations between forecasted and actual system conditions, known as the “true up” process.
For each hour within the weekly horizon, the operating point derived from the weekly-ahead schedule is adjusted by replacing the forecasted demand and renewable generation values with the corresponding “true up” values from the real-time scenario. A new operating point is determined by redispatching only the available reserves, while respecting operational constraints. In cases where the problem is infeasible — meaning reserves are insufficient — load shedding is calculated as a last resort, considering that certain generators may reduce output without ramping constraints but cannot increase generation.
Through this process, quantitative indices related to reserve flexibility are obtained. These include the risk that the “true up” cannot be accommodated within scheduled reserves, the expected shortfall of reserves under “true up” conditions, and the Conditional Value at Risk (CVaR) of reserve shortfall.
Model 4: Peak Reliability Indicators
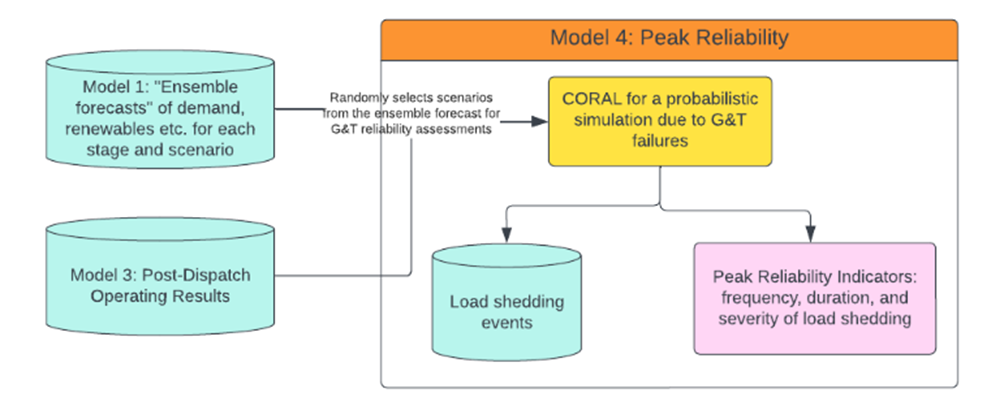
The methodology for estimating peak reliability indicators builds upon the outcomes of the composite generation-transmission reliability model (CORAL). CORAL employs Monte Carlo simulations, randomly sampling failure and repair processes across all generation and transmission components to determine the availability of generation and transmission resources for each hour within a selected peak demand block.
The indicators derived from this methodology include interruption frequency, duration, and severity of supply interruptions, measured as a percentage of hourly demand during peak periods.
Model 5: Resilience and Restoration Indicators
Finally, model 5 will consider the peak reliability simulation results and identify scenarios where load interruptions occurred and select those with a high probability of causing blackouts and model the fault events in the time domain electrical studies. This allows analysis of the depth of load shedding and assessment of whether the event would lead to a blackout, as well as the system’s restoration time following the disturbance.
Resilience indicators derived from this analysis include the occurrence of blackouts and the time required for system recovery after the initiating event.
Conclusions
This report presents a comprehensive framework of performance indicators designed to assess the health and operational effectiveness of electrical systems. By combining metrics derived from detailed probabilistic simulation models, the proposed indicators offer a multidimensional perspective encompassing reliability, flexibility and resilience of power systems.
The simulation-based indicators provide forward-looking insights into the system’s ability to meet demand under uncertainty, its operational flexibility, and its capacity to recover from disruptions.
Together, these indicators form a robust toolset for monitoring system evolution, supporting decision- making, and guiding investments and operational improvements. The establishment of baselines and standardized methodologies further ensures consistency and comparability over time.
