


The increasing penetration of renewable energy sources, particularly wind and solar, brings complex global challenges for electric grid management. In Brazil, energy curtailment—the deliberate reduction of generation—has become increasingly critical, driven by the rapid expansion of variable renewable energy (VRE) sources. This report synthesizes the leading causes of curtailment within the Brazilian power system and details how sophisticated modeling tools can analyze, forecast, and manage this growing phenomenon. Recent historical data reveal a continuous upward trend in curtailment, underscoring the urgent need for robust analytical frameworks. The findings highlight that the mismatch between the pace of renewable integration and the demand growth, plus the expansion of transmission infrastructure, is exacerbating the problem. Methods that account for stochastic simulation and provide hourly granularity and detailed network representation are indispensable for understanding and mitigating curtailment, ultimately contributing to a more resilient and efficient energy transition.
Understanding Curtailment in the Brazilian Context
O curtailment de renováveis, definido como a redução deliberada da geração de energia proveniente de fontes como eólica e solar, tornou-se comum em sistemas elétricos modernos. Essa prática é particularmente relevante no Brasil devido à rápida integração de fontes renováveis intermitentes. Três fatores distintos, porém interconectados, impulsionam principalmente esse fenômeno, cada um contribuindo para a necessidade de limitar a produção desses geradores.
Renewable curtailment, defined as the deliberate reduction of energy generation from renewable sources like wind and solar, has become common in modern power systems. This practice is particularly pronounced in Brazil due to the rapid integration of intermittent renewable sources. Three distinct yet interconnected factors primarily drive the phenomenon, each contributing to the necessity of limiting output from these generators.
Firstly, Energy Balance issues arise when the available supply from inflexible generation sources exceeds the prevailing demand of the system. To maintain the equilibrium required for grid stability, a reduction in production becomes imperative. This imbalance is increasingly common as the share of VRE grows. Secondly, Electrical Reliability concerns frequently necessary curtailment when transmission networks experience congestion. Such bottlenecks can occur at various points, compelling a reduction in generation to ensure the safety and stability of the entire network. This speaks directly to the principle that there is “no transition without transmission,” emphasizing the crucial role of robust grid infrastructure in accommodating new generation. Lastly, External Unavailability refers to an external outage outside the immediate generation complex. These external factors can force a decrease in generation to adapt to new system topologies or address unforeseen limitations within the broader energy infrastructure.
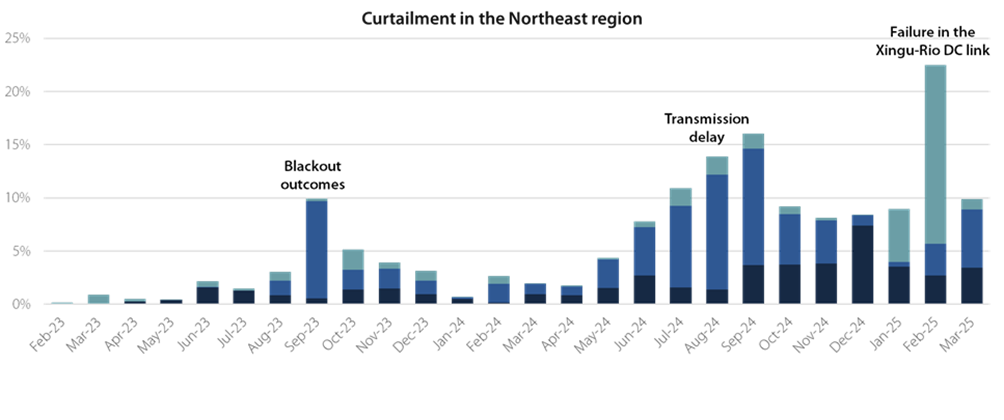
Brazil’s energy landscape has indeed transformed, marked by the extensive integration of wind farms and, more recently, solar plants, both distributed and centralized. This surge was fueled by decreasing investment costs for these technologies and various governmental incentives, including net metering policies, transmission tariff discounts, and exemptions from specific sectoral charges. For instance, in 2024, the system added around 14 GW of installed capacity, of which 99% is composed of wind and solar power plants. However, a critical divergence has emerged: the expansion pace of the transmission network and the growth in energy demand have demonstrably lagged behind the rapid uptake of renewable generation capacity. This mismatch has invariably led to a surplus energy supply, which drives an increasing trend in renewable curtailment. Historical data from 2023 through 2025, presented below, illustrate this upward trajectory, with notable peaks directly linked to transmission delays throughout 2024, where total curtailment in the northeast region within a month reached 15% of the total potential generation.
Projecting Curtailment Using PSR Tools
The initial step involves the definition of key assumptions. These assumptions serve as the bedrock for all subsequent projections and significantly influence the accuracy of curtailment forecasts. This encompasses a demand forecasting process, which accounts for multifaceted factors such as national economic growth and the introduction of disruptive new technologies, including electric vehicles, data centers, and the nascent green hydrogen production sector. Concurrently, the evolution of the supply mix is carefully considered, incorporating projections for the decommissioning of older thermal power plants, distributed generation penetration, which exhibits a distinct dynamic when compared to centralized projects, expected capacity auctions, and indicative generation expansion plans often derived from long-term expansion planning models, such as PSR’s OPTGEN. Given Brazil’s substantial reliance on hydropower, an accurate representation of Inflows is pivotal, drawing upon recent hydrological trends that, unfortunately, indicate below-average long-term inflows. Finally, transmission expansion assumptions meticulously model the projected growth of inter-regional interconnection capacity and the necessary regional network reinforcements for future years.
The second step focuses on database development, which presents a significant integration challenge. The primary objective is to unify an aggregated energy case, representing the overall generation system, with a highly detailed network representation into a single, cohesive database. Firstly, a specialized converter seamlessly imports data from the official NEWAVE model into PSR’s SDDP environment. Once this base is established, the previously defined assumptions are systematically incorporated. This includes the integration of detailed VRE profiles using PSR’s Time Series Lab (TSL) tool. Distributed generation is also modelled, alongside individual centralized power plants. Demand is meticulously detailed with hourly projections, reflecting the time-varying nature of consumption. At this point, the “Energy Case” is settled.
Subsequently, network data from official sources, such as the PAR/PEL configuration provided by ONS, which encompasses a network of approximately 13,000 buses and 17,000 branches, is imported and converted into the SDDP format. Subsequent modifications fine-tune this data, defining load distribution across various buses, establishing connections between generators and the network, and codifying all relevant interconnection constraints. This intricate process culminates in an “Integrated Generation and Transmission (G&T) Case”, a unified and comprehensive database that harmonizes generation and transmission information.
The third step is simulation, which predominantly centers around the SDDP model. This stage involves two distinct but sequential executions. Initially, the “Energy Case” is utilized to calculate the optimal operating policy1 and define the water values for all hydro plants. Then, hourly simulations are conducted, using the “Integrated G&T Case”, incorporating the detailed generation and transmission representations established in the preceding database development phase. The TSL, fully integrated with SDDP, plays a vital role by providing the necessary hourly production scenarios for both wind and solar plants. This integration is paramount for the stochastic simulations designed to address the inherent uncertainty and variability of renewable generation.
1 The “Energy Case” is used for this task to mimic how the ISO calculates the policy.
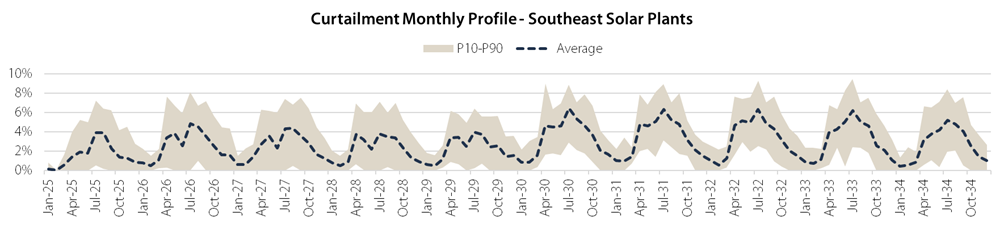
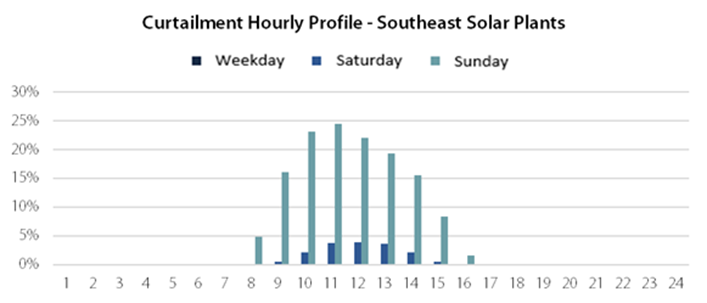
Finally, the fourth step involves analyzing the results of the SDDP execution. The stochastic simulation enables the assessment of the probability distribution of curtailment levels. For example, looking 10 years ahead on a monthly scale, the average total curtailment for a specific group of solar power plants located in the southeastern region of the system can reach approximately 6% of their potential generation, as presented in the figure below. However, under specific scenarios, this value may approach 10%. Also, when analyzing the results with hourly resolution, it becomes evident that curtailment is concentrated during daylight hours, regardless of the technology employed, and tends to be more pronounced on weekends, when electricity demand is typically lower.
The Strategic Value of PSR Tools for Curtailment Forecasting
Curtailment forecasting is vital for the financial and economic analysis of renewable energy projects worldwide, as it can significantly impact their profitability. The in-depth analysis of curtailment within Brazilian power system demonstrates the essential value and robust capabilities of the PSR tools. Their comprehensive functionalities offer a strong suite of resources for navigating the complexities introduced by the rapid expansion of renewable energy.
A key feature that stands out is the capacity for stochastic simulation. This functionality is paramount for assessing many future scenarios, effectively addressing the inherent uncertainty that defines variable renewable generation, such as wind and solar. By modeling a range of potential outcomes, these simulations provide a more realistic and resilient framework for decision-making, moving beyond deterministic approaches to embrace the probabilistic nature of renewable output.
The hourly granularity provided by these tools is another indispensable attribute. This temporal resolution is crucial for dissecting curtailment patterns at various times of day and across weekdays and weekends, offering a detailed temporal understanding. Furthermore, the detailed network representation capability is vital for accurately identifying curtailment directly caused by network congestion. The ability to pinpoint these localized bottlenecks allows for targeted investment in transmission expansion and the deployment of Grid Enhancing Technologies (GETs), essential for a more efficient, safe, and flexible operation of transmission networks.
The seamless integration with the PSR’s expansion planning model (OPTGEN) further enhances the strategic utility of PSR tools. This integration facilitates the simulation of curtailment within optimized long-term future scenarios. Finally, the automated database conversion capability significantly streamlines and optimizes the entire analysis process. This efficiency gain reduces manual effort, minimizes potential errors, and accelerates the time-to-insight, enhancing overall operational and planning effectiveness.
